
Deciphering the Viral Pulse: How Videos Propagate in Social Networks
Video sharing propagation in social networks: Measurement, modeling, and analysis
This paper presents a comprehensive measurement and modeling study of video sharing propagation in Social Networking Services (SNS) using a large-scale dataset from a major Chinese SNS. The authors propose the SI2RP model, an enhanced epidemic framework that accurately simulates the dynamic status evolution of users (watching vs. sharing) and captures the high temporal and spatial locality inherent in social video distribution.
TL;DR
By analyzing 12.8 million sharing events, this paper uncovers the hidden mechanics of how videos "go viral." Unlike static text, video propagation is a highly dynamic "epidemic" fueled by a small set of spreaders and hindered by "free-riders." The introduced SI2RP model provides a mathematical blueprint for predicting social video traffic, revealing that most videos die out within hours despite reaching surprising depths in social graphs.
Background: Beyond Simple "Likes"
In the landscape of SNS (Social Networking Services), video is the heavyweight champion of data. However, how a video moves from one user's feed to another is vastly different from a simple photo. It requires a two-step commitment: a user must decide to watch (Infectious transition) and then decide to share (Permanent transition). Previous research often treated influence as a binary state, but this paper argues that the timing and probability of these transitions are what define network engineering requirements.
User Behavior: Spreaders, Free-riders, and the Ordinary
The study identifies a massive heterogeneity in user behavior.
- The Hubs (Spreaders): A tiny fraction of users initiate thousands of videos, acting as the primary spark for viral cascades.
- The Free-riders: Over 50% of users consume content (sometimes watching over 1,000 videos) without ever clicking "share." These users act as "sinks" that terminate propagation.
- The Correlation Gap: Surprisingly, a user's likelihood to watch a video is almost entirely uncorrelated with their likelihood to share it, suggesting that "activeness" is multi-dimensional.
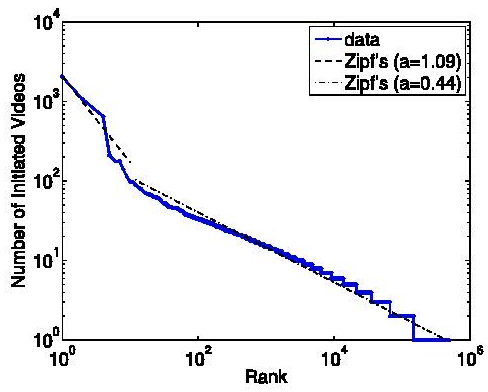 Fig 1. The long-tail distribution of video initiators shows that a few "super-users" drive the majority of initial propagation.
Methodology: The SI2RP Model
To capture this, the authors moved beyond the standard SIR (Susceptible-Infectious-Recovered) model. Their SI2RP framework introduces:
- Immune (Im): Users never exposed to or uninterested in the video.
- Decision Stages (): Probabilistic gates where users decide to click "play" and then "share."
- Permanent (P): Users who successfully share, moving the virus to the next hop.
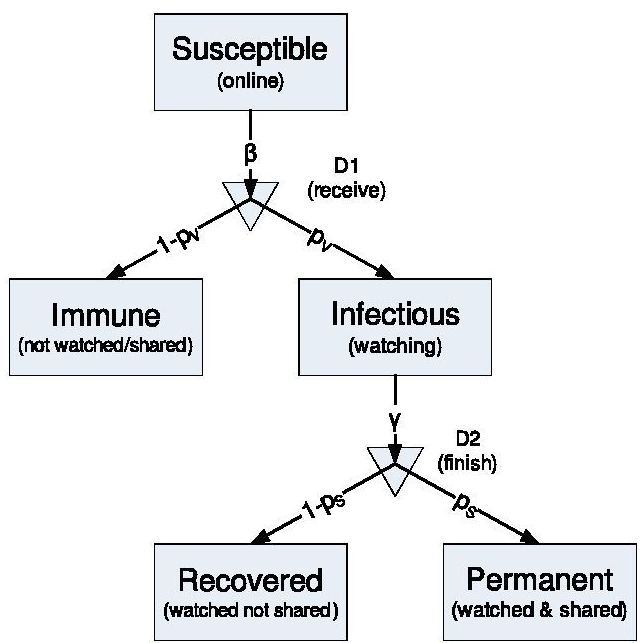 Fig 2. The SI2RP state transition diagram.
Spatial and Temporal Reality
The data debunked several myths about social propagation:
- Extreme Speed: 68% of views happen within the first hour. If a video doesn't catch fire immediately, it likely never will.
- Deep Trees: Unlike emails (which rarely go beyond 4-5 hops), video sharing trees can reach 30 hops, indicating a persistent "pass-along" value.
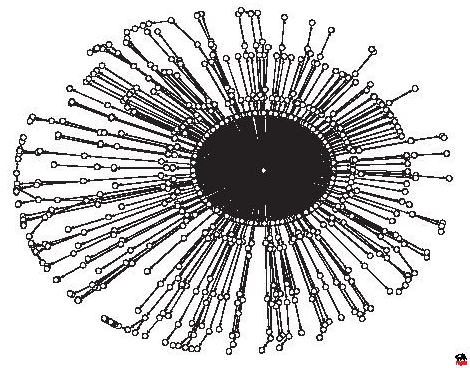 Fig 3. Visualization of propagation trees showing different viral patterns: centralized "spikes" vs. deep "cascades".
Engineering Insight: The P2P and Cloud Dilemma
The most striking conclusion for network engineers is the concurrency paradox. While a video might reach 70,000 people, the number of concurrent viewers is often remarkably low because the propagation is so spread out. This makes traditional Video-on-Demand (VoD) P2P optimizations difficult. The authors suggest that social networks should instead use this data to lease elastic cloud resources (like Amazon EC2) by forecasting demand peaks through the SI2RP model.
Conclusion
This work transforms the "magic" of virality into a predictable epidemic process. By understanding the distinct roles of spreaders and the strict temporal locality of views, SNS providers can better architect their CDNs and backend storage to survive the next big Internet meme.