
ViStruclizer: Deciphering the Hidden Roles in Multi-Dimensional Social Networks
ViStruclizer: A Structural Visualizer for Multi-dimensional Social Networks
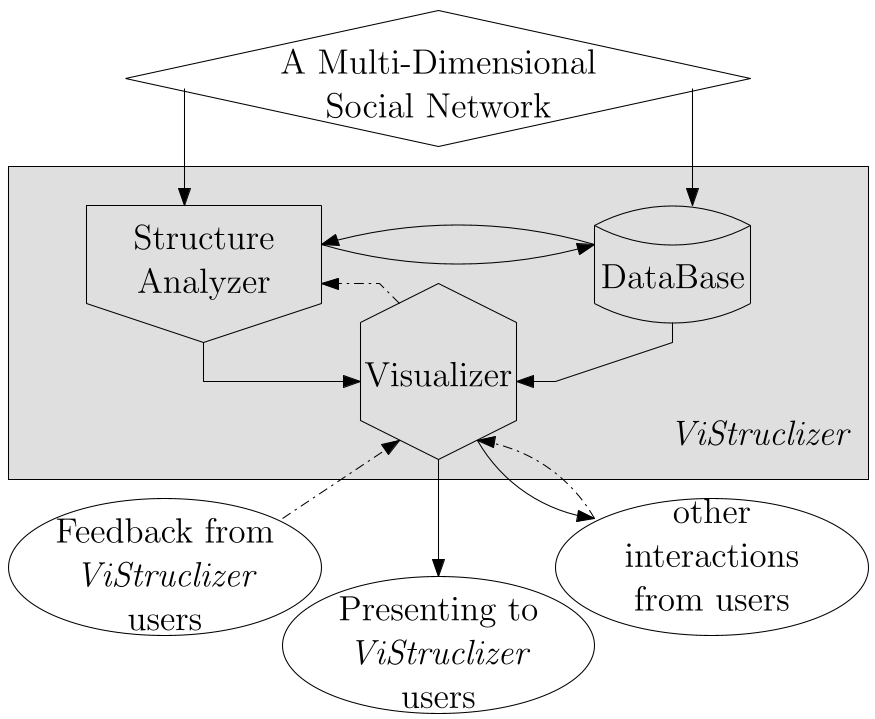
ViStruclizer is a visual analytics system designed for "multi-dimensional" social networks, which contain heterogeneous nodes (multi-mode) and multiple relationship types (multi-relational). It utilizes structure analyzers like Generalized Stochastic Blockmodels (GSBM) to simplify complex graphs into human-interpretable summaries of node clusters and edge cluster roles.
TL;DR
Social networks are no longer just lists of "friends." Modern platforms involve different types of entities (users, photos, videos) interacting through diverse channels (messaging, commenting, collaborating). ViStruclizer is a pioneering visual analytics tool that solves the "hairball" problem of complex networks by summarizing them into interactive node clusters and edge roles, allowing users to refine the AI's understanding through a semi-supervised feedback loop.
The Motivation: Moving Beyond Simple Graphs
In the era of Web 2.0, networks are multi-dimensional. Prior work often treated social graphs as "mono-mode" (one type of node) or "mono-relational." If you reduce a complex interaction—like a director supervising an actor versus two actors collaborating—to a single "edge" type, you lose the semantic richness of the social structure.
The challenge is twofold:
- Scale: Visualizing thousands of nodes leads to unreadable "hairballs."
- Heterogeneity: How do you visualize three different node types and five different relation types simultaneously without overwhelming the viewer?
Methodology: Summarizing via Positional and Role Analysis
ViStruclizer doesn't just cluster nodes based on "who is close to whom" (density-based community detection). Instead, it uses Positional and Role Analysis. It groups individuals who behave similarly into the same "position" (vertex cluster) and defines the relationships between these positions as "roles" (edge clusters).
The Mathematical Backbone
The system treats memberships as probabilistic (Mixed Membership). A node isn't just in Cluster A; it has a probability of belonging to cluster . The core of the analysis is the Generalized Stochastic Blockmodel (GSBM). It models:
- Vertex Weight: The accumulated probability of all nodes in a cluster.
- Edge Roles: Modeled as a multivariate distribution over the set of relations (e.g., the "Directing" role consists of high 'direct' relation frequency and low 'friendship' frequency).
The User Interface: Interactive Refinement
One of the most innovative features of ViStruclizer is its semi-supervised nature. Automated clustering is rarely perfect. ViStruclizer provides a "Radar Chart" interface allowing users to manually adjust a node’s membership. If the AI thinks a Producer belongs in the "Actor" cluster, the user can drag the probability toward the "Producer" axis, and the back-end structure analyzer will re-calculate the entire network summary to accommodate this ground truth.
Experiments: The IMDb Network
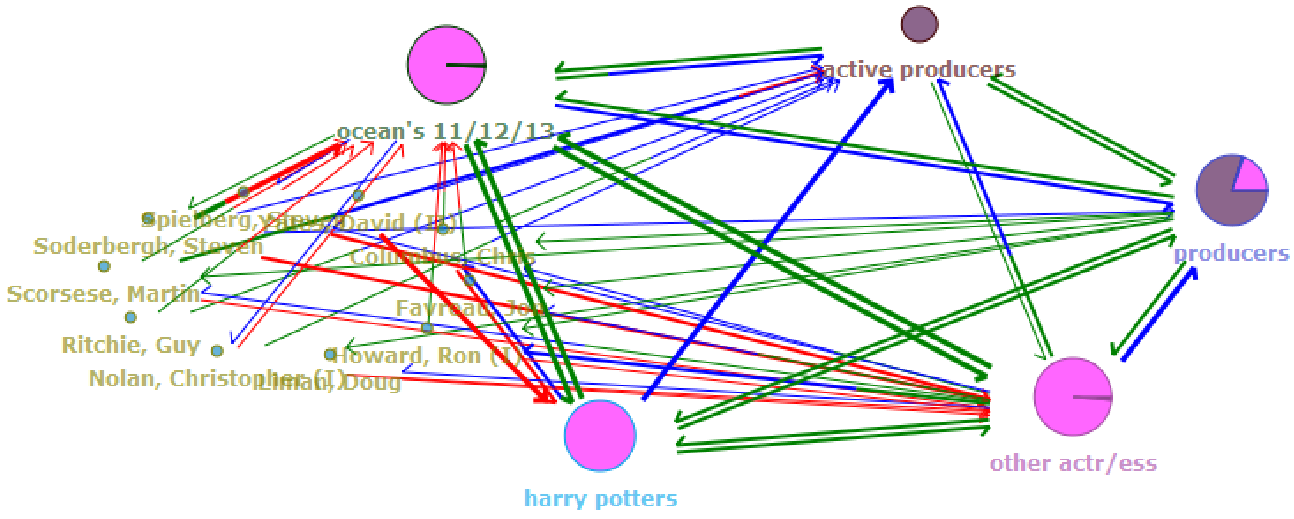
The authors tested the system on a subset of the IMDb network (directors like Spielberg and Nolan, plus their actors/producers).
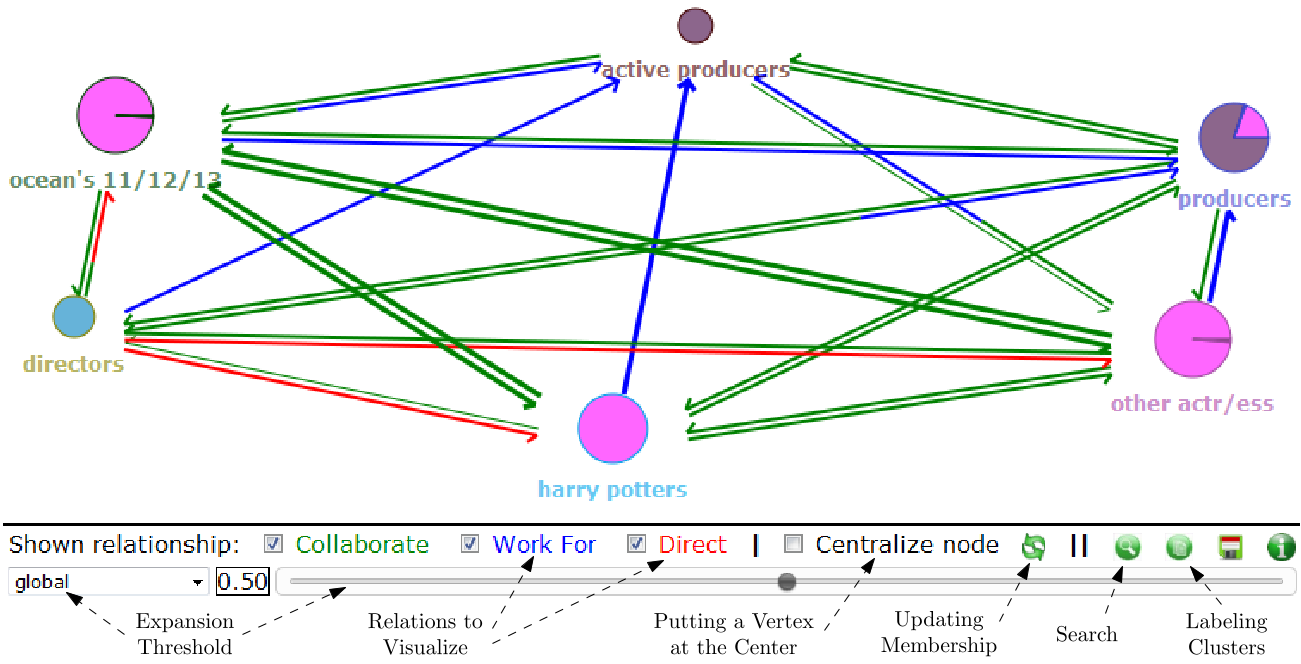
- Vertex Clusters: The system identified meaningful groups like the "Harry Potter" ensemble and the "Ocean’s Eleven" cast.
- Visual Encoding:
- Pies for Nodes: The slices of the pie represent the mix of "Modes" (Actors vs. Directors) within that cluster.
- Multi-Colored Edges: The width shows the strength of the connection, while colors (Red, Blue, Green) indicate the ratio of relations (Directing, Working For, Collaborating).
Critical Insight & Future Work
ViStruclizer successfully shifts the paradigm from "graph drawing" to "structural summarization." However, its dependency on the GSBM model means its speed is bound by the convergence of the EM (Expectation-Maximization) algorithm.
Future Outlook: The authors suggest applying this to dynamic networks like Twitter, where "topics" could be treated as dimensions. Incorporating Graph Neural Networks (GNNs) for the structure analyzer could further improve the scalability and the latent feature extraction of this framework.
Summary Takeaway
For technical practitioners, ViStruclizer provides a blueprint for building "Human-in-the-loop" AI systems. It doesn't ask the user to trust the black box; it gives them the tools to correct the box's math through intuitive visual metaphors.