
iGraph: Visualizing the Hidden Social Fabric of Online Education
Visual Analysis of Online Interactions through Social Network Patterns
This paper introduces iGraph, a visualization system designed for Learning Management Systems (LMS) like Moodle. It transforms hierarchical forum communications into directed graphs using Social Network Analysis (SNA) metrics and simple content filtering to identify key student interactions and sub-communities.
TL;DR
Online forums are the lifeblood of e-learning, but for teachers, they are often a "black box" of disconnected text. This paper introduces iGraph, a tool that maps forum replies into a directed graph. By applying Social Network Analysis (SNA) and filtering out "noisy" content (like "Thanks!"), iGraph allows educators to instantly see who is leading discussions, who is isolated, and where the real learning sub-communities are forming.
Background: Beyond Post Counts
In traditional Learning Management Systems (LMS) like Moodle, teachers are usually given a dashboard of "vanity metrics": number of logins, number of posts, and time spent online. However, these metrics fail to answer the most critical pedagogical questions:
- Who is actually driving the intellectual discourse?
- Are students talking to each other, or just to the teacher?
- Is the group fragmented into silos, or is it a cohesive learning community?
The authors argue that the relational aspect (the structure of the conversation) is more important than the raw volume of data.
Methodology: Mapping Social Intelligence
The iGraph system operates on three distinct layers:
1. The Interaction Graph
The system models the forum as a directed graph , where:
- Nodes (V): Participants (Students/Teachers). Node size scales with participation.
- Edges (E): A "Reply-to" action. Edge thickness indicates the frequency of interaction between two specific individuals.
2. Social Network Analysis (SNA) Metrics
Instead of subjective observation, iGraph applies quantitative metrics:
- Degree Centrality: Identifies the "Popular" or "Infiuential" nodes.
- Density: Measures the overall "connectedness" of the class ().
- Clique Detection: Automatically groups students who interact frequently with each other, uncovering informal study groups.
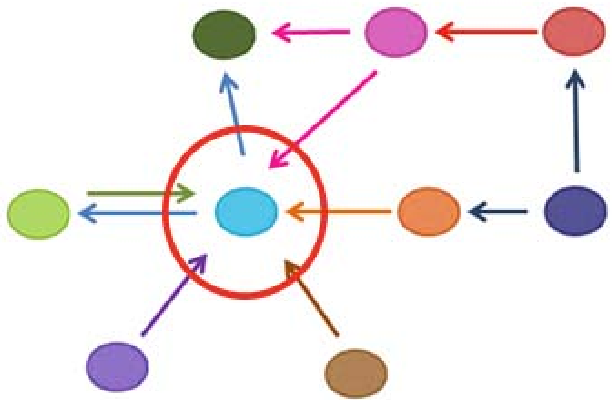 Figure 1: Visualizing a highly centralized network where a single person dominates the flow.
3. Content Relevance Filtering
Not every post is meaningful. Using a "Stop Word" threshold, iGraph flags messages that lack substantive content (e.g., short replies like "I agree"). This is a crucial step because "noise" can often mask the true structural dynamics of a discussion.
Experiments and Results: The "Moodle Success" Case Study
The researchers tested iGraph on a real-world forum thread. Initially, the network seemed broad. However, once the Content Analysis was applied, the results shifted significantly:
- The Actor "CA" disappeared: This student posted, but their contributions were deemed "irrelevant" based on the threshold, revealing they weren't truly contributing to the intellectual exchange.
- Centrality Shift: The Centralization Index (in-degree) jumped from 36% to 45%, proving that the meaningful content was much more concentrated than the raw post count suggested.
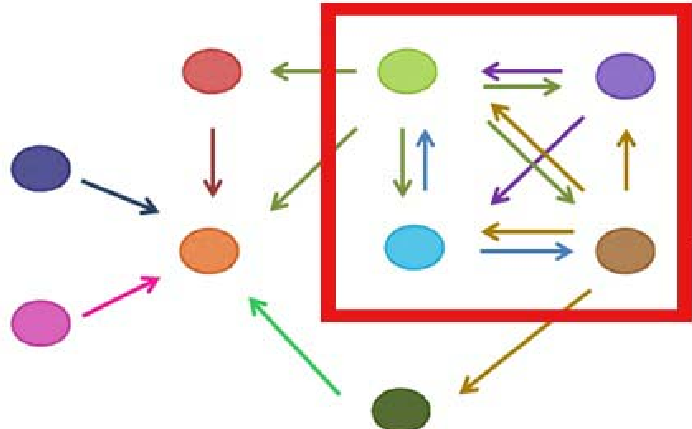 Figure 2: Identifying sub-communities (Cliques) within the larger forum structure.
Critical Insight: The Value of "Sinks" and "Sources"
The system excels at identifying:
- Sources: Students who initiate high-value threads but rarely reply.
- Sinks: Students who consume information and reply but rarely initiate.
- Outliers: Isolated students who are at risk of dropping out due to lack of social integration.
Conclusion & Future Outlook
While iGraph currently relies on simple keyword-based filtering, its strength lies in its real-time visual feedback. It transforms a tedious manual auditing task into a visual diagnostic tool.
Future Step: Integrating Natural Language Processing (NLP) to detect the sentiment or argumentative quality of the edges would further refine the "relevancy" metric, moving from "is this student talking?" to "is this student helping others learn?"
Reference: Silva, A., & Figueira, Á. (2011). Visual Analysis of Online Interactions through Social Network Patterns.