
Visual Reasoning about Social Networks Using Centrality Sensitivity: Beyond Static Metadata
Visual Reasoning about Social Networks Using Centrality Sensitivity
This paper introduces "centrality sensitivity" as a novel metric for social network analysis, providing analytical solutions to compute how a node's importance changes relative to others. The authors derive derivatives for Eigenvector and Markov centralities, utilizing these to enhance visual reasoning, network simplification, and uncertainty assessment.
TL;DR
While traditional social network analysis tells us who is important (Centrality), it rarely explains why or how that importance shifts when the network evolves. This paper introduces Centrality Sensitivity—a mathematical derivative of importance. By calculating how one node's change affects everyone else, the authors unlock "signed" visualizations (friendship vs. competition), more accurate network simplifications, and a new way to measure the reliability of network statistics.
The "Hairball" Problem and Spectral Intuition
Most large-scale network visualizations eventually succumb to the "hairball" effect—a dense, unreadable clump of nodes where structural significance is lost. While we use Centrality (like PageRank or Betweenness) to size nodes, these metrics are static.
The authors' core insight is that Centrality is actually a multivariate function of the network's structure. If we treat the adjacency matrix as an input, we can use the Calculus of Variations to find the rate of change. This tells us the "influence region" of a node: if a specific individual gains a new connection, whose prestige rises (collaboration) and whose falls (competition)?
Methodology: Differentiating Importance
The paper focuses on two main classes of centrality:
- Eigenvector Centrality (Feedback-based): Like PageRank, where your importance depends on your neighbors.
- Markov Centrality (Random Walk-based): Based on the expected time it takes for a "token" to travel between nodes.
The authors derived analytical solutions for these derivatives. Instead of re-calculating the entire network's stats for every possible change (which is computationally ruinous), they use the pseudoinverse of the Laplacian and the fundamental matrix of the Markov chain to find sensitivities in a single pass.
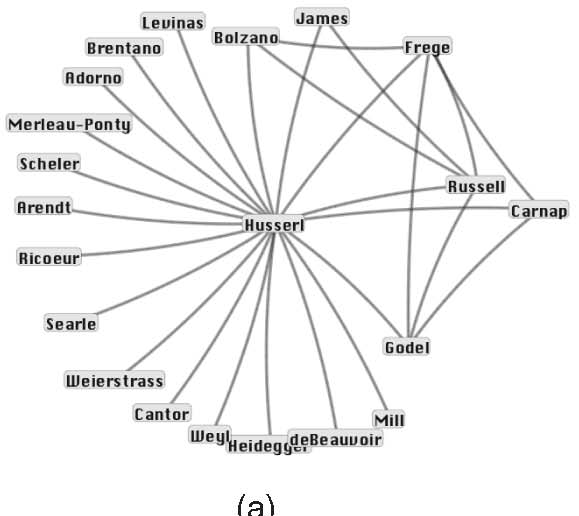 Fig 1: Illustrating sensitivity. (a) A subset of intellectual influence. (b) How Russell's degree change affects others' centrality. (c) Visualizing these derivatives as signed edges.
Key Breakthroughs in Visual Reasoning
1. Friendship vs. Enmity
By looking at the sign of the sensitivity, we can characterize groups:
- Positive Sensitivity (Blue): Collaborative groups. If one person gets more famous, the whole group's prestige rises (e.g., a research lab).
- Negative Sensitivity (Red): Competitive groups. Importance is a zero-sum game (e.g., a star network where peripheral nodes compete for the hub's attention).
 Fig 2: Color encoding identifies interaction types. (a) Sparse/Competitive clusters. (b) Tightly connected collaborative groups.
2. Centrality-Preserving Simplification
Standard methods to "clean up" a graph (like Minimum Spanning Trees) often accidentally make the most important nodes look insignificant. The authors found that by weighting edges using Eigenvector Sensitivity, they could prune 90% of the edges while keeping the "Centrality Landscape" intact.
 Fig 3: Comparison of simplification strategies. Note how Sensitivity-based methods (top row) keep nodes closer to the diagonal—meaning the simplified graph "feels" like the original.
3. Reasoning about Uncertainty
In real-world data (like the MIT Reality Bluetooth proximity set), links are often noisy. Sensitivity allows analysts to perform Uncertainty Propagation. If we aren't sure about the connections of Node A, sensitivity tells us exactly how much that doubt "infects" the importance rankings of Node B through Z.
Critical Analysis & Future Outlook
This work represents a bridge between Graph Theory and Interactive Visualization.
- Strengths: The analytical derivation for Eigenvector sensitivity is a major win for performance, making real-time interactive "influence exploration" possible.
- Limitations: Markov Centrality sensitivity still requires complexity due to matrix inversion, which limits its use on billion-node graphs without hierarchical approximation.
- Takeaway: Future network analysis tools should stop treating Centrality as a static label and start treating it as a dynamic field that reacts to structural perturbations.
Main Reference: Correa, C. D., Crnovrsanin, T., & Ma, K. L. (2012). Visual Reasoning about Social Networks Using Centrality Sensitivity. IEEE TVCG.