
Architecting Your Social Future: Interactive Growth in Co-authorship Networks
A visual recommendation system for co-authorship social networks (ChinaVis 2018)
This paper introduces an expectation-driven visual recommendation system for co-authorship social networks. It moves beyond traditional similarity-based link prediction by allowing users to interactively direct the growth of their personal social networks (PSN) based on specific tag distribution goals, demonstrated on the DBLP academic dataset.
TL;DR
Researchers from ChinaVis 2018 present a visual recommendation system that allows scholars to "steer" the evolution of their professional circles. Unlike typical systems that suggest "people like you," this tool enables you to define a target "social persona" (e.g., wanting 50% of your co-authors to be AI experts) and simulates how adding specific individuals will help you reach that goal through both direct and potential network shifts.
The Problem: The Curse of Monotony
Standard recommendation engines are built on the principle of homophily—the idea that you want to meet people similar to yourself. While mathematically "accurate," this creates a "rich-get-richer" effect where your network becomes an echo chamber. For an interdisciplinary researcher, this is a death sentence.
Existing tools treat recommendation as a static snapshot. They don't account for the Dynamic Shift: when you collaborate with a Machine Learning expert, you don't just gain one link; you gain access to their entire sphere of influence, fundamentally changing who the system will recommend to you tomorrow.
Methodology: Visualizing the "Direct" and "Potential"
The core of the system is the PSN Characteristic Model. A user's network is defined by the aggregation of their friends' tags (e.g., publication venues).
1. The Descriptor
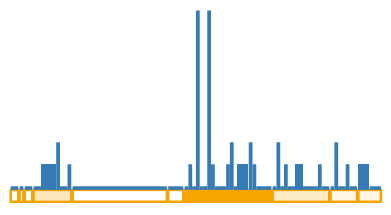
Every user is represented by a vector g(v), which is the sum of the tag distributions of their neighbors. The goal is to minimize the difference between your current descriptor and a target "Expectation."
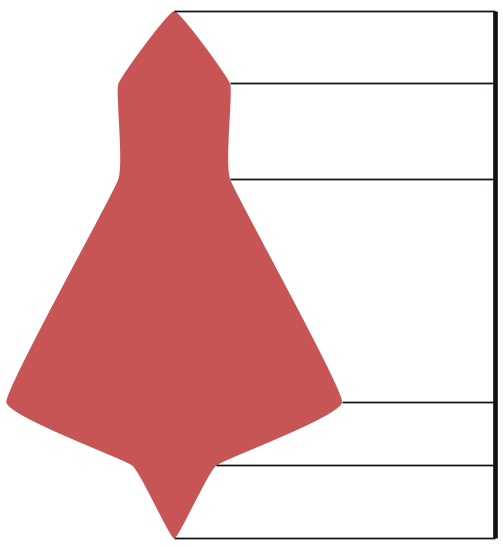
2. Radial Visual Encoding
To help users make decisions, the authors designed a compact radial glyph:
- The Blue Curve: Shows the direct contribution of a candidate to your tag distribution.
- The Red Glyph (Potential): Represents the "reachable" tags introduced by the candidate’s own network.
- The Brown Dashed Line: The user's specific target or "Expectation."
Exploration & Simulation
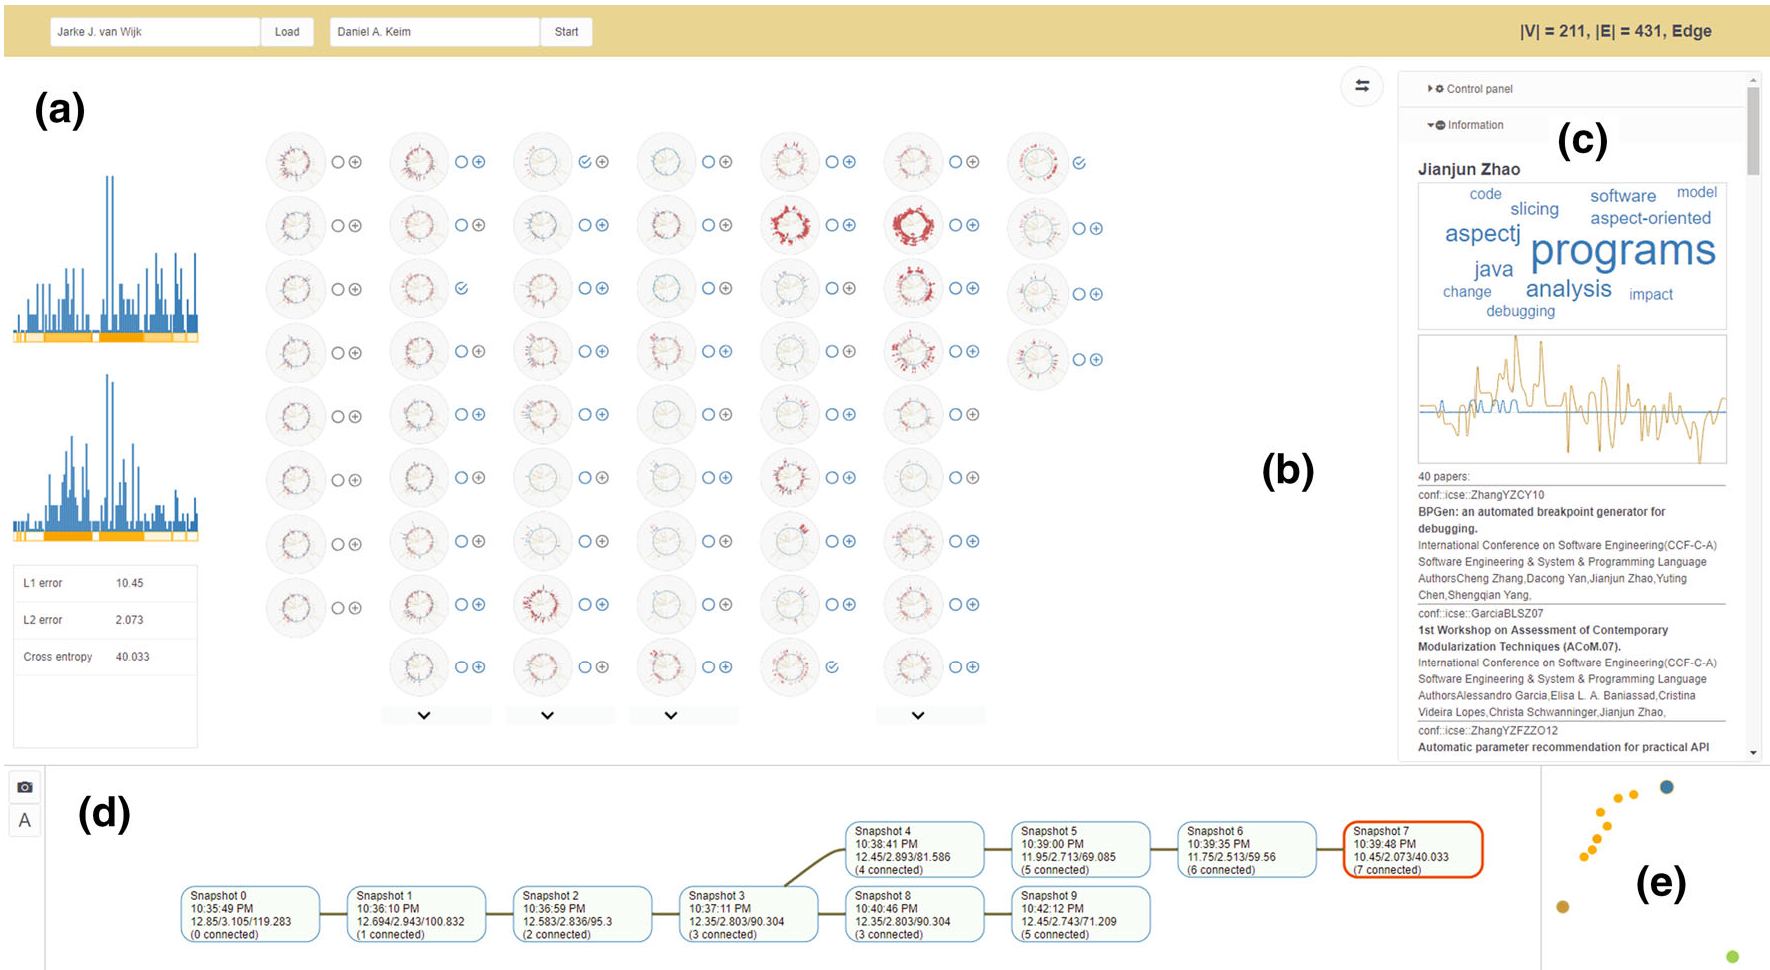
The system functions like "Git for Social Growth." It includes a History View with a branching logic (git-like flow). A user can:
- Pick a candidate.
- Simulate the link.
- Observe the ripple effect on the whole network.
- If the result isn't optimal, "roll back" and try a different branch.
Key Insights from Case Studies (DBLP Data)
The authors tested the system on nearly 165k researchers from the DBLP database.
- The Multi-Step Strategy: To move from "Computer Graphics" into "Data Mining," a simple similarity search fails because the groups are too far apart.
- The Breakthrough: By using the system's "Potential Influence" visualization, users could identify "bridge" researchers—people who might not be data mining experts themselves but have strong connections to that field. This DFS-like approach reached the target distribution significantly faster than automated algorithms.
Critical Analysis & Conclusion
Takeaway
The value of this research lies in its Human-in-the-loop philosophy. It acknowledges that social growth is a strategic act, not just a mathematical probability.
Limitations
- Tag Density: The system relies on the rich, objective metadata of academic venues. It might struggle on platforms like Facebook where tags are sparse or messier.
- Computational Cost: Recalculating the "Potential Influence" for dozens of candidates in real-time is expensive on large graphs.
Future Outlook
As we move toward "AI-assisted living," tools that allow us to consciously design our social environments—rather than being passively fed by algorithms—will be essential to combatting polarization and fostering interdisciplinary innovation.