
Mapping the Social Graph: A Strategic Landscape of R Packages for Social Media Analytics
Visualisation for social media analytics: landscape of R packages
This paper provides a comprehensive landscape of R packages for Social Network Analysis (SNA) and Social Media Analytics (SMA). It categorizes open-source tools within the R ecosystem, specifically focusing on their capabilities for visualizing complex node-edge relationships and multivariate social data.
TL;DR
With social media users projected to hit 4.4 billion by 2025, the ability to visualize complex human connections is no longer a luxury—it is a requirement. This paper systematically reviews the R software ecosystem, providing a framework that aligns Social Network Analysis (SNA) theories with practical R packages like igraph, statnet, and ggraph. It demonstrates how these tools move beyond static charts to provide deep insights into network topography, sentiment, and influence.
The Visualization Gap in Social Big Data
While the industry has become adept at "scraping" social media, the transition from raw data to decision-making remains bottlenecked by the complexity of the data. Social Media Analytics (SMA) is inherently multi-dimensional, involving:
- Network Architecture: Who is connected to whom (Nodes and Edges).
- Spatial-Temporal Dynamics: How information diffuses across geographies over time.
- Content Nuance: The sentiment and topics embedded within the text.
Traditional BI tools often fail at representing these relational structures. The research identifies that a structured approach is missing for practitioners to choose the right visualization "weapon" for their specific analytical "target."
Methodology: The R Ecosystem as a Network Workbench
The paper argues that R’s strength lies in its modular architecture. Rather than a monolithic tool, R provides a layered approach based on the "Grammar of Graphics."
Core Framework Components:
- Foundation Packages:
igraphandnetworkprovide the mathematical backbone for handling graph objects, capable of processing large-scale datasets that many GUI-based tools struggle with. - Statistical Modeling: Packages like
ergm(Exponential Random Graph Models) andRSienaallow researchers to simulate network growth and evolution, moving visualization from descriptive to predictive. - Specialized Analysis:
CINNAis highlighted for centrality analysis (identifying "influencers"), whiledendextendmanages the visualization of hierarchical clusters.
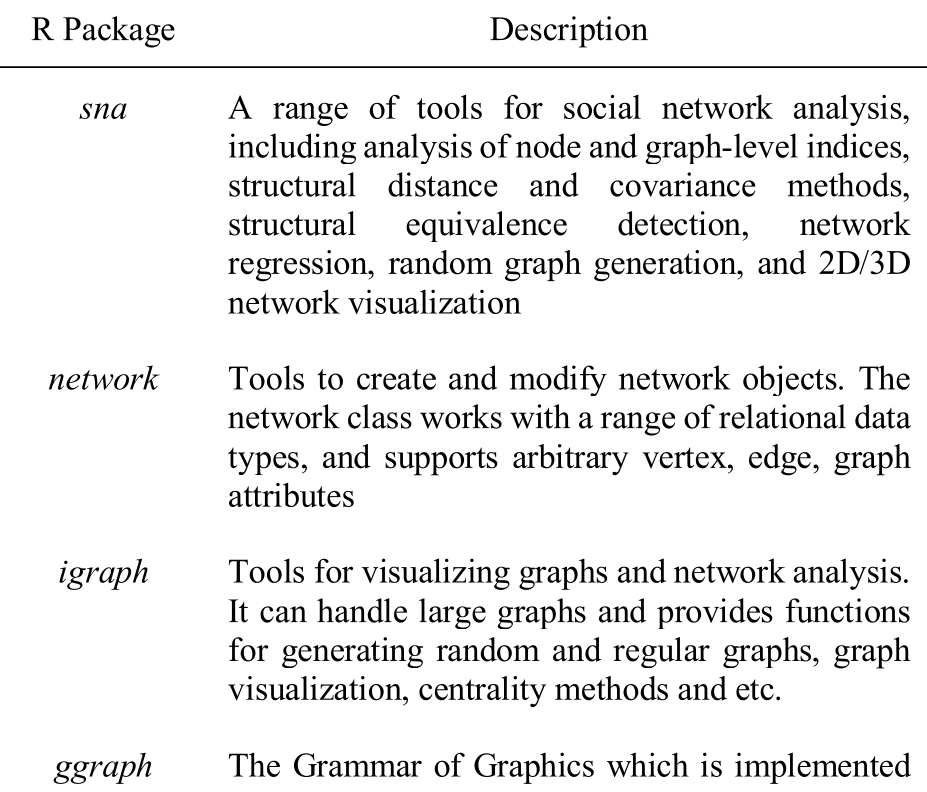 Above: A summary of foundational R packages and their specific roles in graph visualization.
Real-World Application: Healthcare Analytics
To validate this landscape, the authors highlight a case study involving diabetes prevalence in Nigeria. By scraping 371,996 posts using the rvest package and preprocessing text with the tm (Text Mining) framework, researchers were able to:
- Map the behavior of healthcare providers vs. patients.
- Identify lifestyle risk factors through community detection.
- Visualize the diffusion of health information to design better medical interventions.
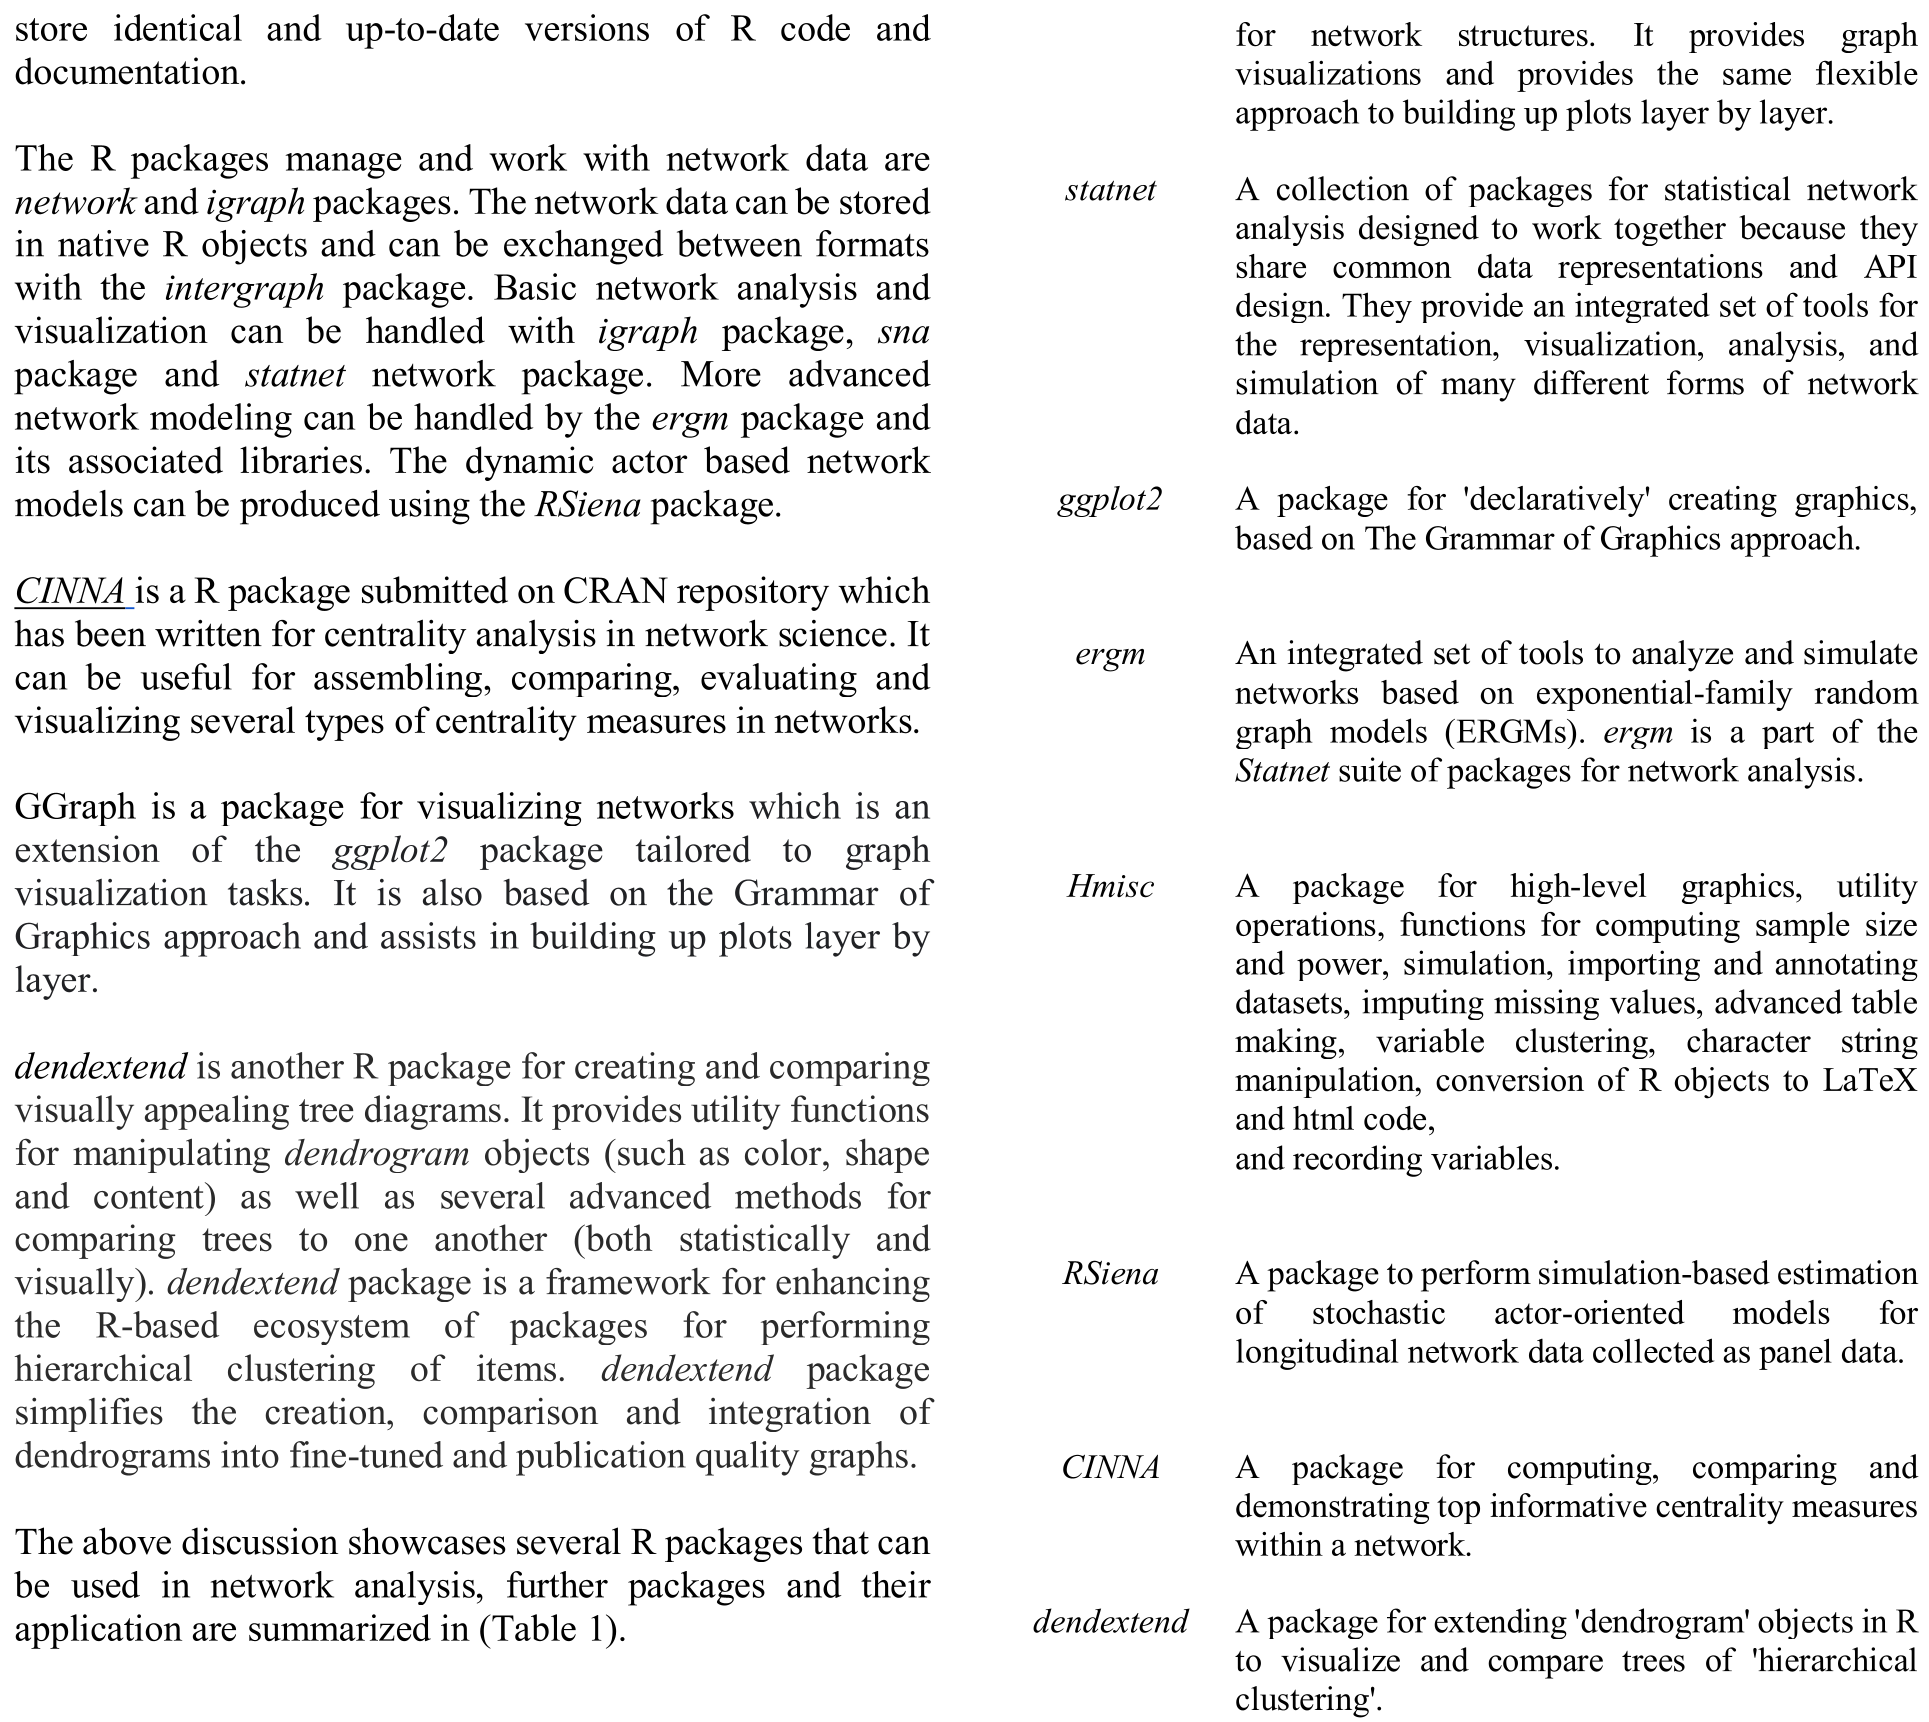 Above: Specialized packages like CINNA and RSena extend R's capabilities into statistical network modeling.
Critical Insight: Beyond Static Sociograms
The paper concludes that the "landscape" of R is shifting towards Interactive Visual Analytics. The traditional static "hairball" sociogram is being replaced by dynamic, multi-layered representations.
However, the authors acknowledge a critical limitation: the learning curve of R remains high compared to "point-and-click" software like Gephi or NodeXL. For organizations, the trade-off is between Ease of Use and Analytical Depth. R offers unparalleled depth, particularly when combining ggplot2 for aesthetics and igraph for topology.
Future Outlook
The next frontier in SMA visualization involves:
- Real-time API Integration: Enhancing packages like
rtweetandRfacebookto handle live streaming data. - Advanced Personas: Moving beyond nodes to "persona visualization" to understand individual user journeys within the macro-network.
- Hybrid Approaches: Utilizing R's
Shinyframework to build custom, interactive dashboards that allow non-technical stakeholders to explore complex graph data.
In summary, this paper serves as a roadmap for any data scientist looking to move beyond simple bar charts and enter the complex, rewarding world of network science.