
Deciphering the Expert Eye: Visualizing Decision-Making in Digital Pathology for Education
Visualization of Decision Making in Digital Pathology as Educational Tool
This paper introduces a visualization framework for digital pathology that records and processes the diagnostic process of experienced pathologists to create educational "roadbooks." By tracking navigation paths, magnification changes, and verbal commentary, the system transforms expert decision-making into interactive Web and Moodle-based learning modules.
TL;DR
Pathology training is shifting from the physical microscope to the digital screen. However, seeing the result of a diagnosis isn't enough—trainees need to see how an expert searches a slide. This paper presents a framework that records an expert pathologist’s "journey" through a tissue specimen, converting their panning, zooming, and spoken thoughts into interactive, visual "roadbooks" for students.
Problem & Motivation: The Gap Between Theory and Intuition
The acquisition of theoretical knowledge in pathology is straightforward, but "practical intuition"—knowing where to look and what to ignore—is notoriously hard to teach.
Historically, this required a mentor-mentee connection over a multi-headed microscope. While digital pathology moved slides to the screen, most e-learning platforms still offer "static" views. They show the final diagnosis but ignore the Implicit Knowledge:
- Why did the pathologist zoom in on that specific cluster of cells?
- How long did they spend deliberating over a benign-looking area?
- What was the sequence of navigation across the specimen?
The authors aim to capture this "pathological journey" to transform it into a traceable, ubiquitous learning path.
Methodology: Mining the Diagnostic Journey
The core of the system is the synchronization of traditional microscopy with digital data structures.
- Data Assessment: An experienced pathologist's "signing out" process is video-recorded. Their panning (movement) and magnification changes are tracked while their verbal findings are recorded and transcribed.
- Computer Vision Integration: Using OpenCV template matching, the system aligns video frames with high-resolution Whole Slide Images (WSI). This converts a video stream into a set of precise coordinates and zoom levels.
- Visualization Layers: The raw data is transformed into three pedagogical views:
- The Roadbook: A chronological log of every decision point.
- Heat Maps: Visualizing focus areas where the duration of observation (color-coded from red to green) indicates complexity or importance.
- The Timeline: A graph showing how magnification levels fluctuated over time, providing insight into the "overview-to-detail" logic.
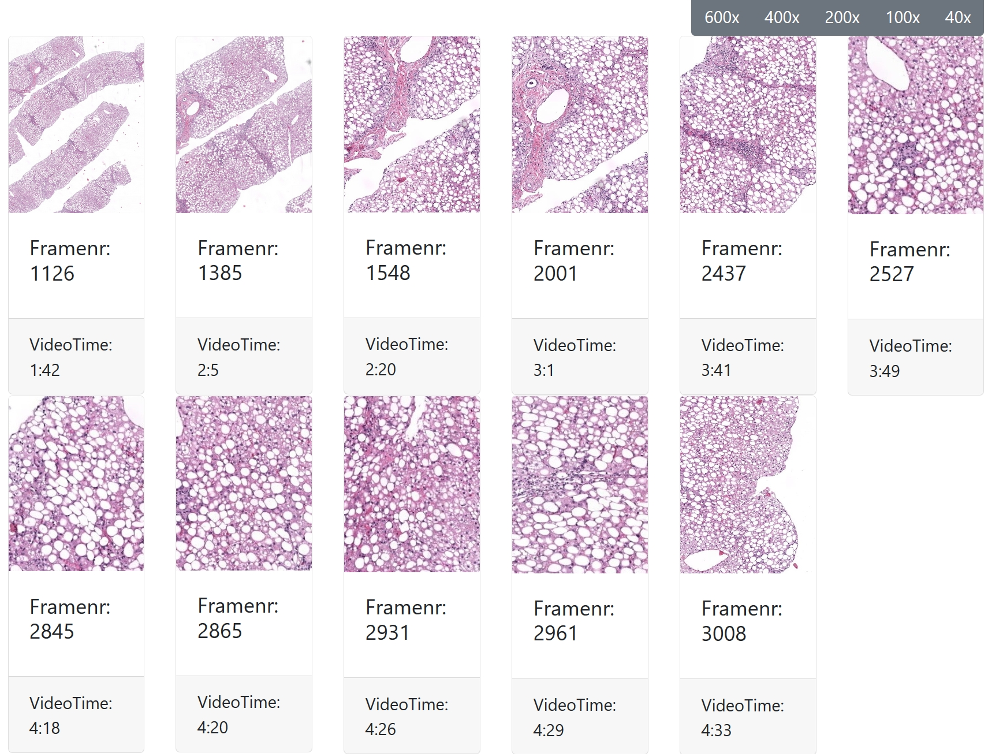 Fig 1: Identifying "Decision Points" by magnification levels to restructure a continuous video into segments.
Experiments & Results: From Lab to LMS
The research moves beyond theory by implementing these visualizations into a Moodle-based Learning Management System (LMS).
Key Visual Assets for Trainees:
- Hotspots & Heat Maps: Trainees can see exactly which parts of the tissue are "suspicious" based on expert attention.
- Synchronized Annotation: As a student watches the diagnostic video, the corresponding digital slide (WSI) position moves in sync, accompanied by transcribed expert commentary.
- Self-Assessment: The integration allows for "Drag-and-Drop" quizzes where students must identify regions of interest that match the expert’s findings.
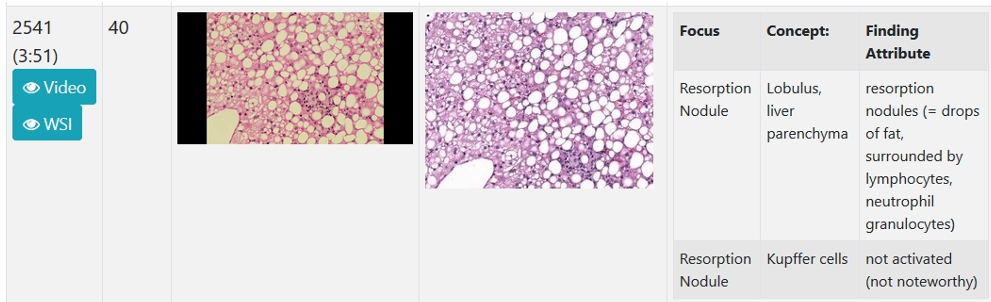 Fig 2: Heat maps visualizing viewing frequency and duration—essential for helping trainees build pattern recognition skills.
The authors emphasize that this method facilitates Ubiquitous Learning, allowing students to access rare cases and expert logic from any device without needing physical access to glass slides.
Critical Analysis & Conclusion: The Path Toward Explainable AI
This work is more than just a teaching tool; it’s a precursor to Explainable AI (XAI). By documenting the "human path" to a diagnosis, we create a gold-standard dataset for how AI should navigate a slide.
Limitations & Future Work
While the system is robust, the current data assessment requires manual effort from experts to record and dictate. Future iterations might utilize Eye-Tracking instead of manual video restructuring to further automate the capture of "attention."
Final Takeaway
By making the "inner monologue" and "visual search" of a pathologist visible, we bridge the gap between digital images and diagnostic mastery. This "journey-based" approach ensures that the next generation of pathologists learns not just what a disease looks like, but where and how to find it.
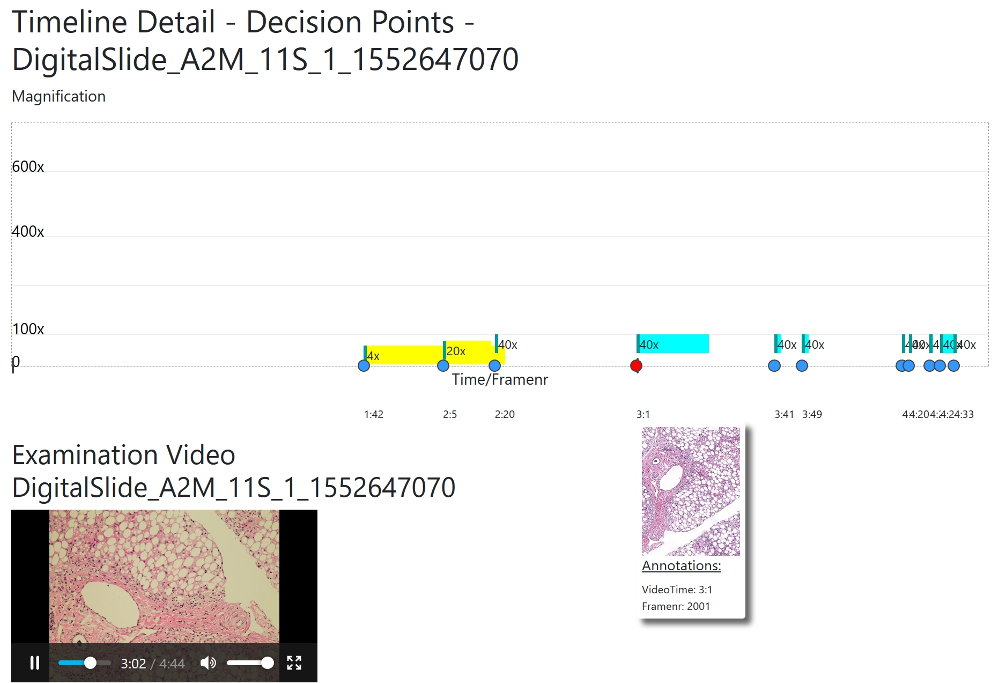 Fig 3: The decision timeline: Mapping zoom levels and "Decision Points" to provide a narrative of the diagnostic process.