
Mapping the Invisible Infrastructure: Visualizing Teacher Social Capital in Engineering Education
Visualization of Teacher Social Capital in a Computer-Supported Engineering Education Teacher Professional Development Program
This study employs Social Network Analysis (SNA) to evaluate teacher social capital within INSPIRE, an NSF-funded engineering education professional development program. By utilizing the UCINET software, the research maps relational data among 90 teachers to visualize connectivity, identify influential "gatekeepers," and measure network density.
TL;DR
The success of engineering education doesn't just depend on curriculum quality, but on the Social Capital—the web of collaboration and reciprocity—among teachers. This study uses Social Network Analysis (SNA) to visualize how 90 teachers in the INSPIRE program interact, revealing that while the community is healthy and decentralized, school and cohort boundaries still create significant "structural holes" that need bridging.
The Motivation: Moving Beyond Individual Metrics
In the realm of Teacher Professional Development (TPD), we often measure success through individual surveys: Did the teacher learn the content? Does the teacher feel confident?
However, the authors of this study argue that these "variable analyses" miss the Relational Data. Engineering education is inherently collaborative. For a program like INSPIRE to scale, it requires a robust learning community where teachers act as "hubs" and "bridges" for one another. The motivation here is to treat the teacher community as a living organism rather than a collection of individuals, using SNA to identify where the "social glue" is strong and where it is failing.
Methodology: The Mechanics of Connectivity
The study utilized a self-reported social network survey processed through UCINET. The researchers looked at two primary metrics to define the "overall health" of the teacher network:
- Density (21.7%): This measures how many actual connections exist compared to the maximum possible. A density of 21.7% suggests a functional community that still has room for deeper integration.
- Centralization (34.088%): This indicates whether the network revolves around a single "super-star" or is distributed. The relatively low percentage confirms a decentralized network, which is more resilient because it doesn't collapse if one person leaves.
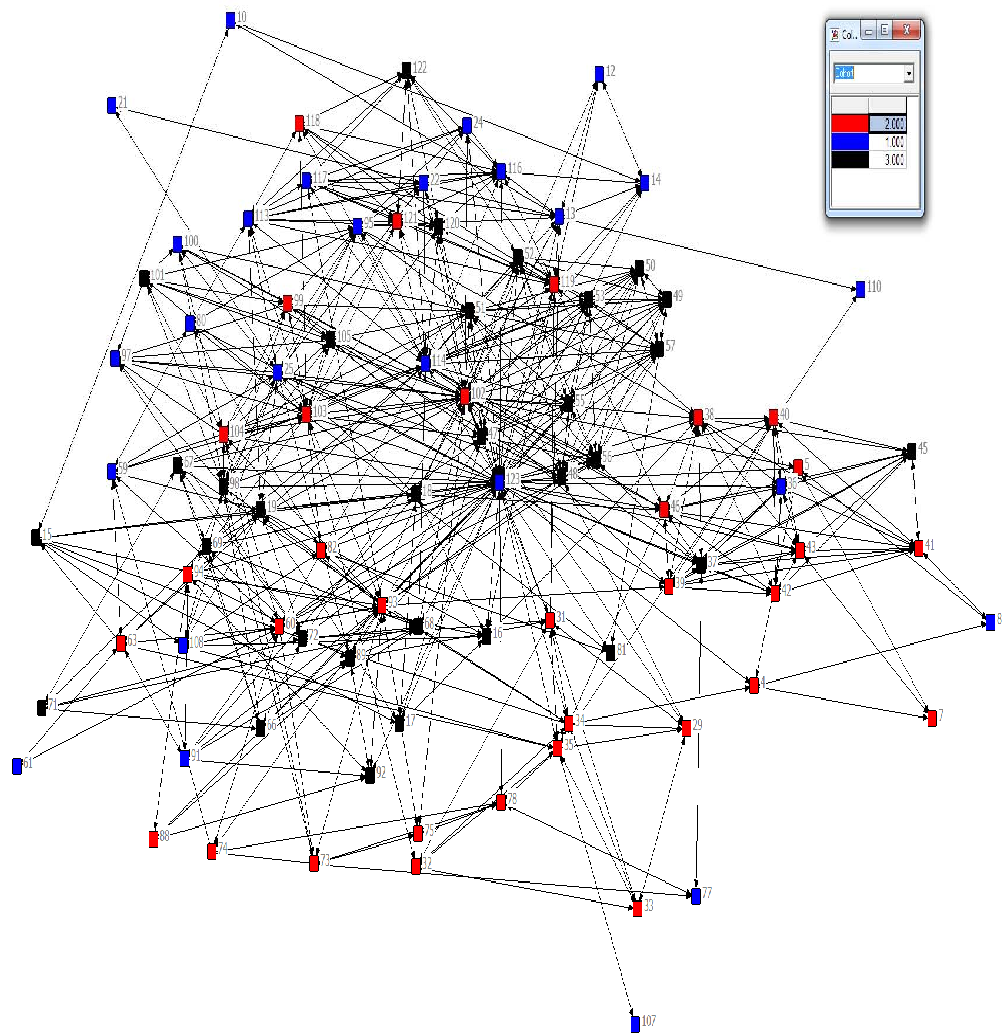
Key Findings: Hubs, Gatekeepers, and Structural Holes
The visualization revealed several critical insights into how social capital is distributed:
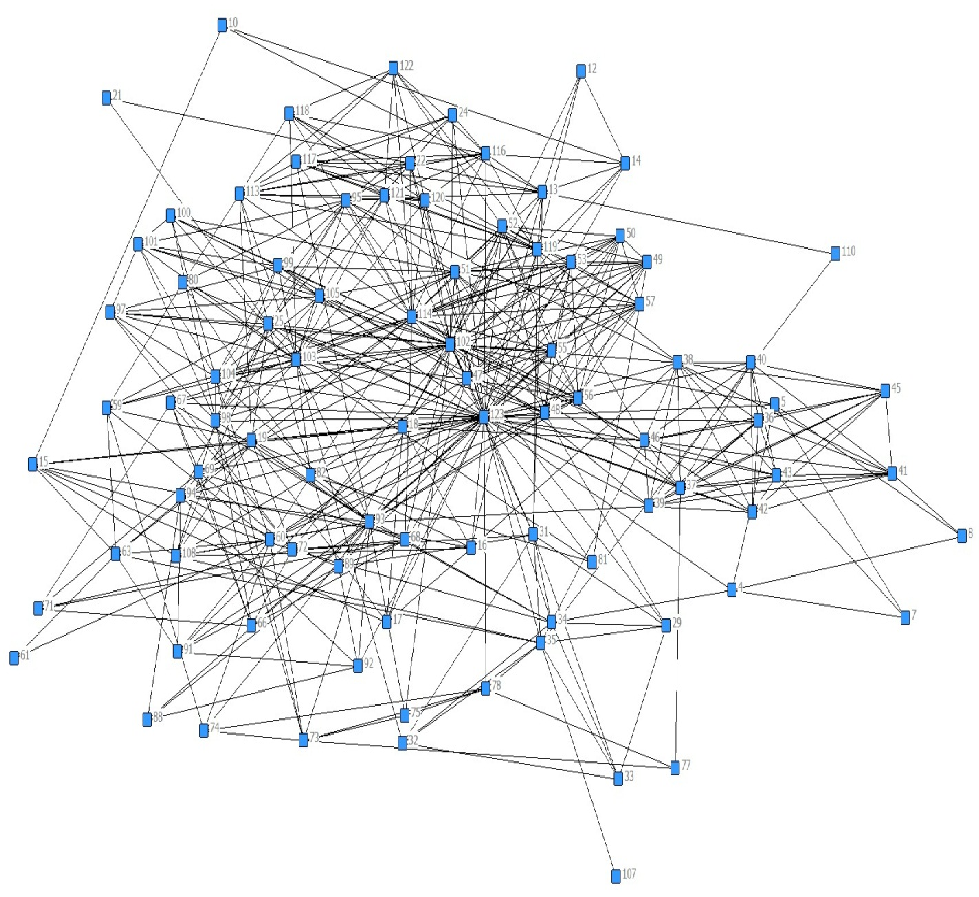
- The Power of the "Teacher in Residence": Teacher 123, acting as the resident expert, was situated at the dead center of the sociogram. This confirms that designated support roles are essential for maintaining network cohesion.
- The "School Effect": The data showed that teachers are far more likely to collaborate with colleagues from their own school and cohort. While natural, this creates Structural Holes—gaps between different schools that prevent the spread of best practices across the district.
- Identifying Gatekeepers: The analysis identified eight subgroups. In these groups, certain "big nodes" act as information gatekeepers. For program administrators, these are the most valuable participants, as they are the primary channels for disseminating new materials and gathering feedback.
Critical Analysis & Future Outlook
The value of this research lies in its ability to make the invisible visible. By identifying "periphery" teachers (like Teachers 7, 8, and 110), program leads can take proactive steps to pull them into the center, preventing burnout and isolation.
Limitations: The study relies on self-reported data, which can be subject to recall bias. Furthermore, it measures the existence of a connection but not necessarily the quality or depth of the interaction.
Takeaway for the Industry: For any CSCL (Computer-Supported Collaborative Learning) initiative, the goal should be to move beyond decentralized networks toward higher density across organizational boundaries. Future professional development should focus specifically on "cross-pollination" between schools to turn isolated clusters into a unified professional ecosystem.