
Visualizing the Mind: Bridging EEG and IoT for Real-time Emotion Mapping
Visualizing Emotion and Absorption Through a Low Resolution LED Array: - From Electroencephalography to Internet of Things
The paper introduces a pilot Brain-Computer Interface (BCI) system that visualizes human emotional and absorptive states using an Emotiv EPOC plus wireless EEG headset and a Particle-integrated 8x8x8 LED array. The core achievement is the real-time mapping of neurophysiological data to physical light patterns via an Internet of Things (IoT) infrastructure.
TL;DR
This research presents a functional Brain-Computer Interface (BCI) that translates complex brain activity—specifically emotion and focus—into a physical, 3D light display. By combining affordable wireless EEG technology with the Internet of Things (IoT), the authors have created a "luminous sphere" that changes color, speed, and size based on the user's mental state, offering a new frontier for eSports training and artistic expression.
Background Positioning
In the landscape of Human-Computer Interaction (HCI), this work serves as a bridge between medical-grade neuroscience and creative technology. While BCI research often stays within the confines of clinical rehabilitation or screen-based interfaces, this study moves brain data into the physical environment using IoT, positioning it as a significant pilot in the "Neuro-IoT" domain.
Problem & Motivation: Beyond the Self-Report
Traditionally, if a designer wanted to know how a user felt while playing a game, they had to ask. However, self-report surveys are notoriously unreliable due to feeling distortion and the inability to capture the dynamic flow of an experience.
While EEG (Electroencephalography) offers a solution by recording raw electrical signals from the brain, medical-grade devices are "unwieldy and expensive." The authors' intuition was to leverage the new wave of commercial off-the-shelf (COTS) wireless EEG headsets to create a real-time feedback loop that is accessible to designers, artists, and coaches without requiring a PhD in neuroscience.
Methodology: The "Neuro-IoT" Stack
The system architecture is a multi-layered communication pipeline that transforms micro-volts on the scalp into photons in an LED array.
1. The EEG Layer
The team used the Emotiv EPOC plus, a 14-channel wireless headset. While it has fewer sensors than medical 256-channel systems, it provides robust APIs for extracting:
- Valence: The positive or negative nature of the affect (Interesting level).
- Arousal: The intensity of the feeling (Excitement level).
- Absorption: The degree of concentration (Focus level).
2. The Communication & IoT Layer
Data flow follows a high-speed path:
- Data Acquisition: Python-based scripts capture EEG indicators.
- Transmission: WebSockets ensure a "keep-alive" connection for real-time streaming.
- Output Control: The Particle Photon (a Wi-Fi-enabled microcontroller) receives the data and manipulates the LED array.
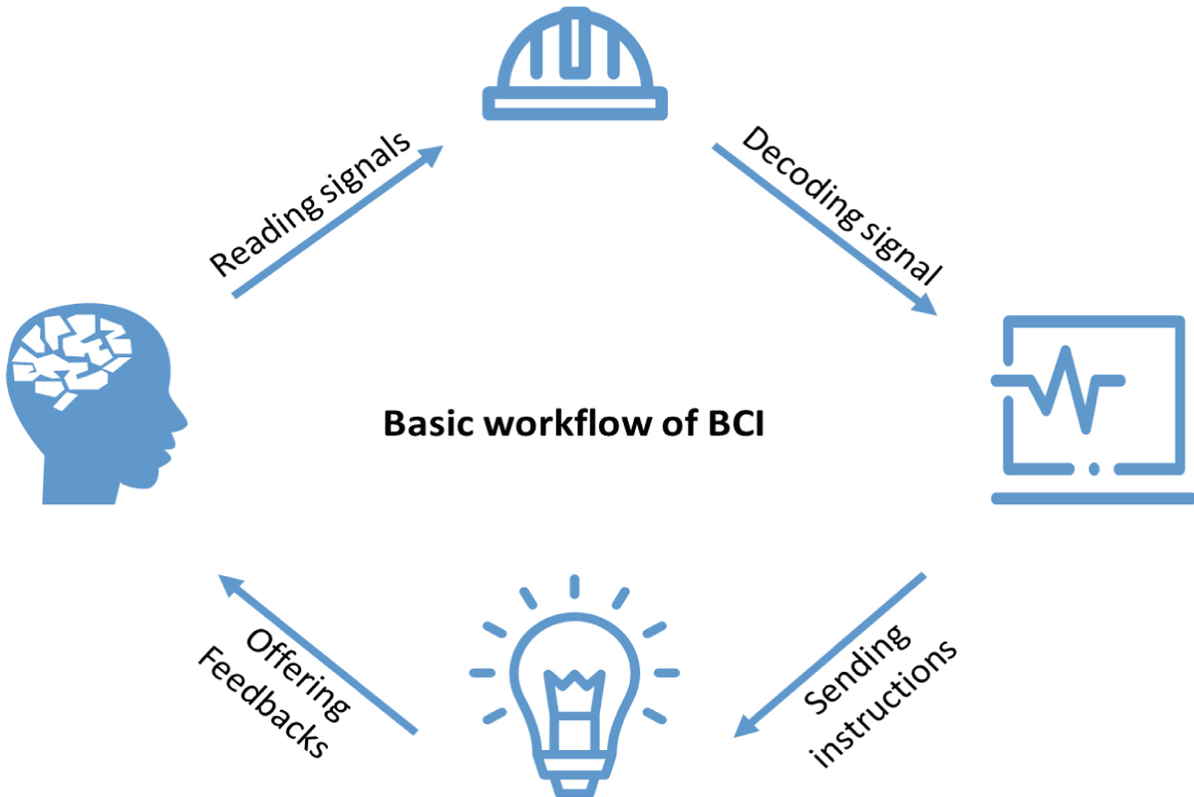 Figure 1: The standard BCI workflow implemented in this study: Reading -> Processing -> Mapping -> Feedback.
Experiments: The Racing Game Showcase
To validate the prototype, the researchers utilized a simulated racing game—a known trigger for high arousal and intense focus.
Mapping Logic
The visualization is designed based on three physical metaphors:
- Color: Shifts from Blue (Low Positive) to Red (High Positive).
- Pulsing Speed: Reflects the user's excitement; faster pulses indicate higher arousal.
- Max Shell Size: A wider sphere indicates a higher "Focus" or absorptive state.
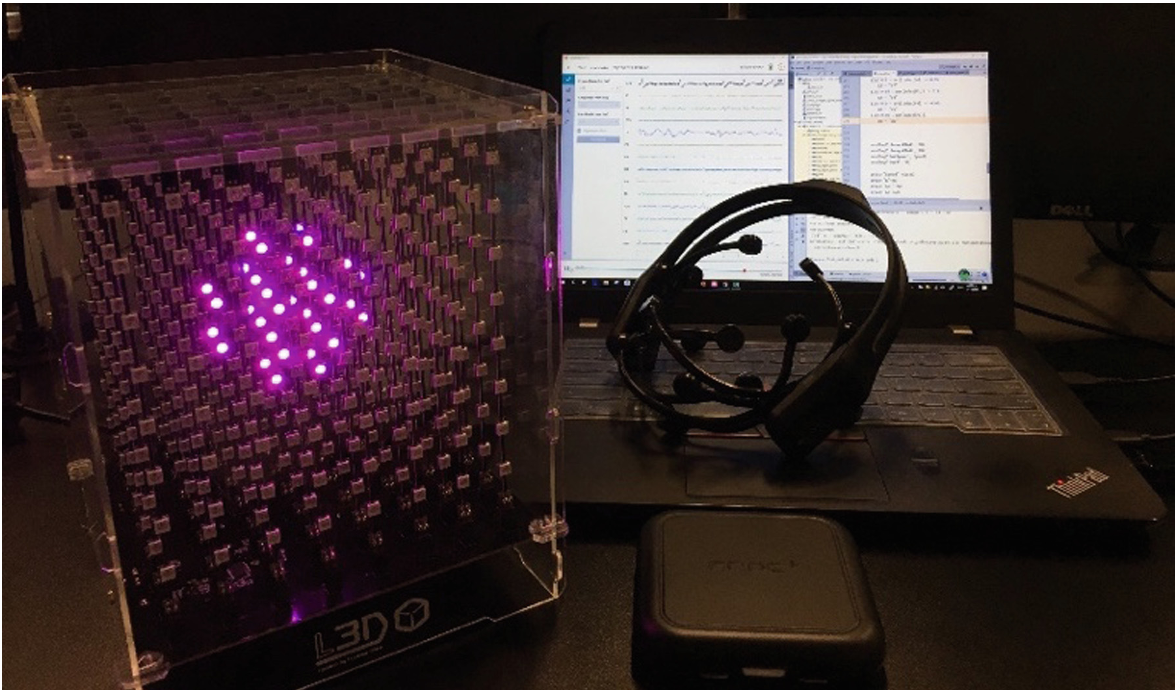 Figure 2: The visual mapping of emotional valence to LED color.
The results showed that during the racing task, the LED array successfully mirrored the player's immersion. When the player was "in the zone," the LED shell expanded to its maximum size and shifted toward red hues as the excitement of the race peaked.
Critical Analysis & Conclusion
Takeaway
This study proves that the barrier to entry for BCI is dropping. By using an 8x8x8 LED cube, the researchers moved away from traditional 2D graphs toward a more intuitive, "ambient" form of data visualization.
Application: The Future of eSports
The authors specifically highlight eSports training. In high-pressure environments, athletes often "choke." This system could act as a real-time monitor for coaches to see exactly when a player's focus wavers or when their anxiety levels (arousal) spike, allowing for immediate psychological intervention.
Limitations & Future Work
The primary limitation is the simplicity of the visualization. An 8x8x8 grid is low-resolution, and current mapping ignores the spatial location (topography) of brain activity. Future iterations could use higher-resolution displays and more complex interaction design where the user "controls" the environment through mental commands, rather than just visualizing them.
Ultimately, this study is a clarion call for the HCI community to integrate neuro-feedback into everyday objects, turning the "black box" of the human mind into a readable, physical interface.