Beyond the List: Visualizing Social Geometry and Automating Friend Groups
A method of visualizing friends relations and recommending groups in online social network
The paper proposes a visualization and group recommendation method for ego-centric social networks. It transforms a user's friend list into an undirected graph by identifying "maximal complete sub-graphs" (cores) and mapping them as overlapping circles to represent social density and relationship proximity.
TL;DR
Social media "friend lists" are functionally efficient but cognitively poor. This paper presents a methodology to transform these lists into intuitive, area-proportional diagrams. By identifying "maximal complete sub-graphs" (cores) and using a simplified energy-minimization model, the researchers provide a way to visualize social density and automatically recommend group categorizations.
Background: The Problem with Linear Socializing
In platforms like Facebook or RenRen, we perceive our social world through a "Friend List." As this list grows into the hundreds or thousands, we lose the global structure. We cannot easily see which friends know each other, who belongs to which life chapter (high school vs. work), or who acts as a bridge between communities.
Existing graph layouts often result in "hairballs"—tangles of lines where the distance between dots has no physical or social meaning. The authors argue that an effective visualization must follow two principles:
- Semantic Proximity: Actors with more shared connections should be drawn closer.
- Even Distribution: The layout must use space efficiently to avoid clutter.
Methodology: From Cliques to Circles
The core innovation lies in shifting the focus from individual nodes to Cores.
1. Distance Calculation
The system first calculates a modified shortest-path matrix among all actors. If two friends aren't connected within six degrees, they are treated as disconnected to simplify the computation.
2. Finding and Merging Cores
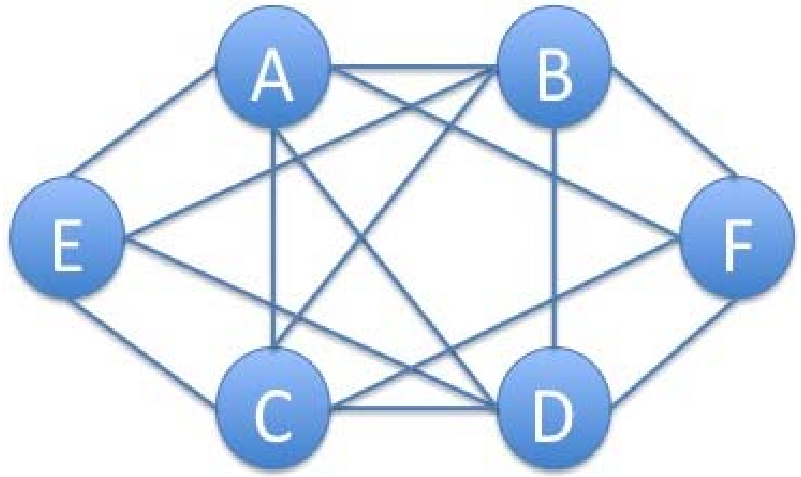
A "Core" is defined as a maximal complete sub-graph—a group where every member knows every other member. Since raw clique detection often generates thousands of nearly identical groups, the authors implement a Merging Strategy: if the intersection of two cores exceeds 80%, they are merged. This reduces the problem from thousands of nodes to a manageable handful of "Social Cores."
3. Energy-Based Layout Optimization
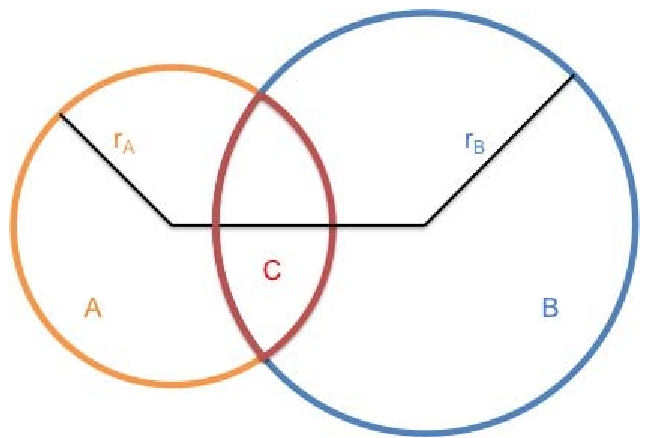
Instead of simulating physics for every node, the algorithm calculates the "Energy" of the entire diagram based on the difference between theoretical intersection areas (calculated from shared friends) and actual intersection areas in the drawing. By minimizing this energy (E), the circles naturally move to positions that represent the true social overlap.
Visualizing the Results: Identifying Social Context
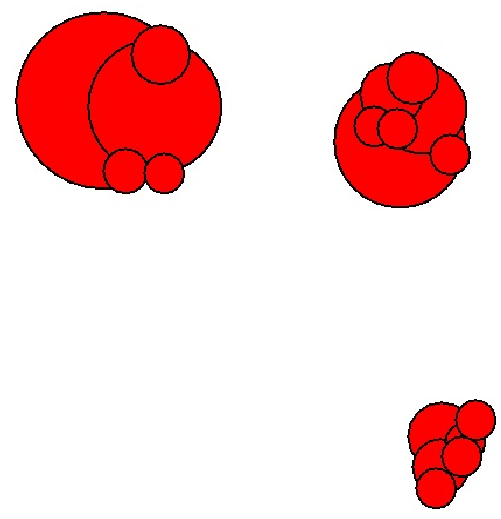
When applied to real data from RenRen, the algorithm produced layouts where distinct clusters were immediately visible.
In the experiment, the user could instantly identify three primary groups: junior high school, high school, and college friends. This isn't just a pretty picture—it's actionable data. By extending a core group with its intersecting cores, the system can automatically suggest "Groups" for the user to join or manage, solving the tedious problem of manual friend categorization.
Critical Insight & Perspective
The genius of this paper is its dimensionality reduction. By treating social groups as physical areas (circles) rather than just points, the visualization mirrors the human mental model of "social circles."
While modern methods might use Graph Neural Networks (GNNs) for clustering, this "Core-to-Circle" approach is highly interpretable. It respects the privacy constraints of modern APIs, as it only requires the immediate ego-network (who of my friends are friends with each other) rather than the global social graph of the entire platform.
Conclusion
This work bridges the gap between graph theory and user experience. By transforming abstract relational data into a meaningful spatial layout, it allows users to "explore" their social landscape.
- Takeaway: Effective social visualization should be area-based, not just node-based.
- Future Path: Integrating dynamic zooming and real-time clustering could allow users to manage thousands of relationships with a few clicks, turning the "friend list" into a "social map."