
AFEWeb: Bridging the Gap Between Performance Metrics and Model Intuition
Visualizing the Performance of Computational Linguistics Algorithms
The paper presents AFEWeb, a thin-client visualization system and analysis portal designed to evaluate the performance of computational linguistics algorithms. It integrates interactive tools like Confusion Matrices, ROC curves, and novel document-level word visualizations to debug and optimize high-dimensional document classification and clustering models.
TL;DR
AFEWeb is an innovative web-based analysis portal that replaces static performance reports with interactive, linked visualizations. By combining ROC curves, Confusion Matrices, and word-level importance maps, it allows researchers to see exactly how threshold adjustments affect classification and why specific words drive model decisions—all within a responsive "thin-client" browser environment.
Background Positioning
In the landscape of computational linguistics, we often focus on the "what" (Accuracy, F1 scores) rather than the "why" (Which words caused this error? How does the threshold shift the bias?). AFEWeb sits at the intersection of Information Retrieval and Human-Computer Interaction (HCI), providing a SOTA debugging environment for vector-space models.
Problem & Motivation: The "Black Box" of Aggregate Statistics
Algorithm developers often face a "bottleneck of insight." When a model misclassifies a document, a static Confusion Matrix tells you it happened, but not why. Traditional desktop tools capable of providing this depth are hard to share and maintain. The authors identified a crucial need for a tool that:
- Quantifies performance unambiguously.
- Allows real-time "What-if" analysis for classification thresholds.
- Exposes the internal semantic abstractions (word weights) to the user.
Methodology: Real-Time Interaction via Architectural Ingenuity
The core technical challenge was providing a 100ms response time for UI updates when the underlying data is massive. The authors solved this not through raw compute power, but through pre-computation.
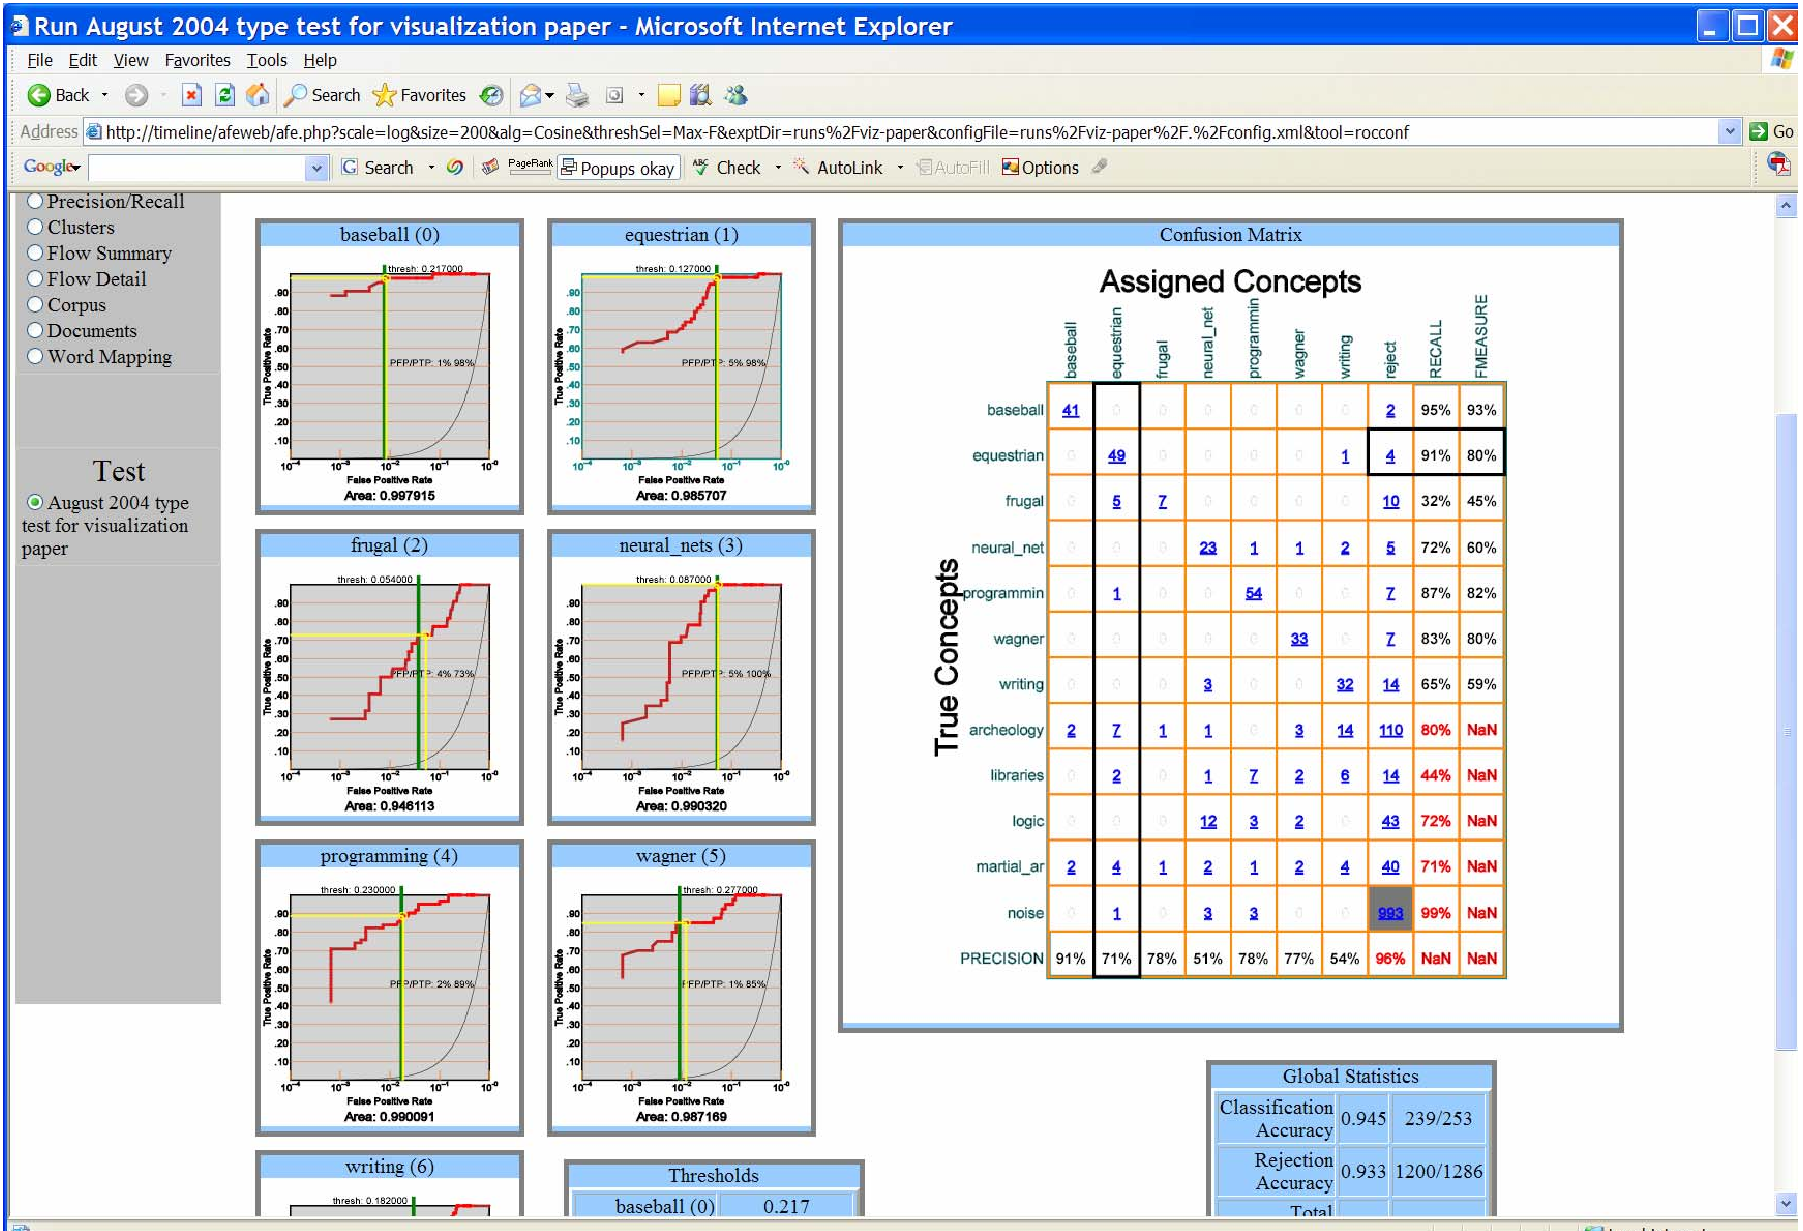
1. Linked ROC & Confusion Matrices
Instead of re-calculating the matrix on the server when a user slides a threshold line on an ROC curve, the system pre-computes "change points." These are stored in lookup tables downloaded to the browser via AJAX. A simple binary search on the client side then updates the matrix instantly.
2. Word-Level Semantic Visualization
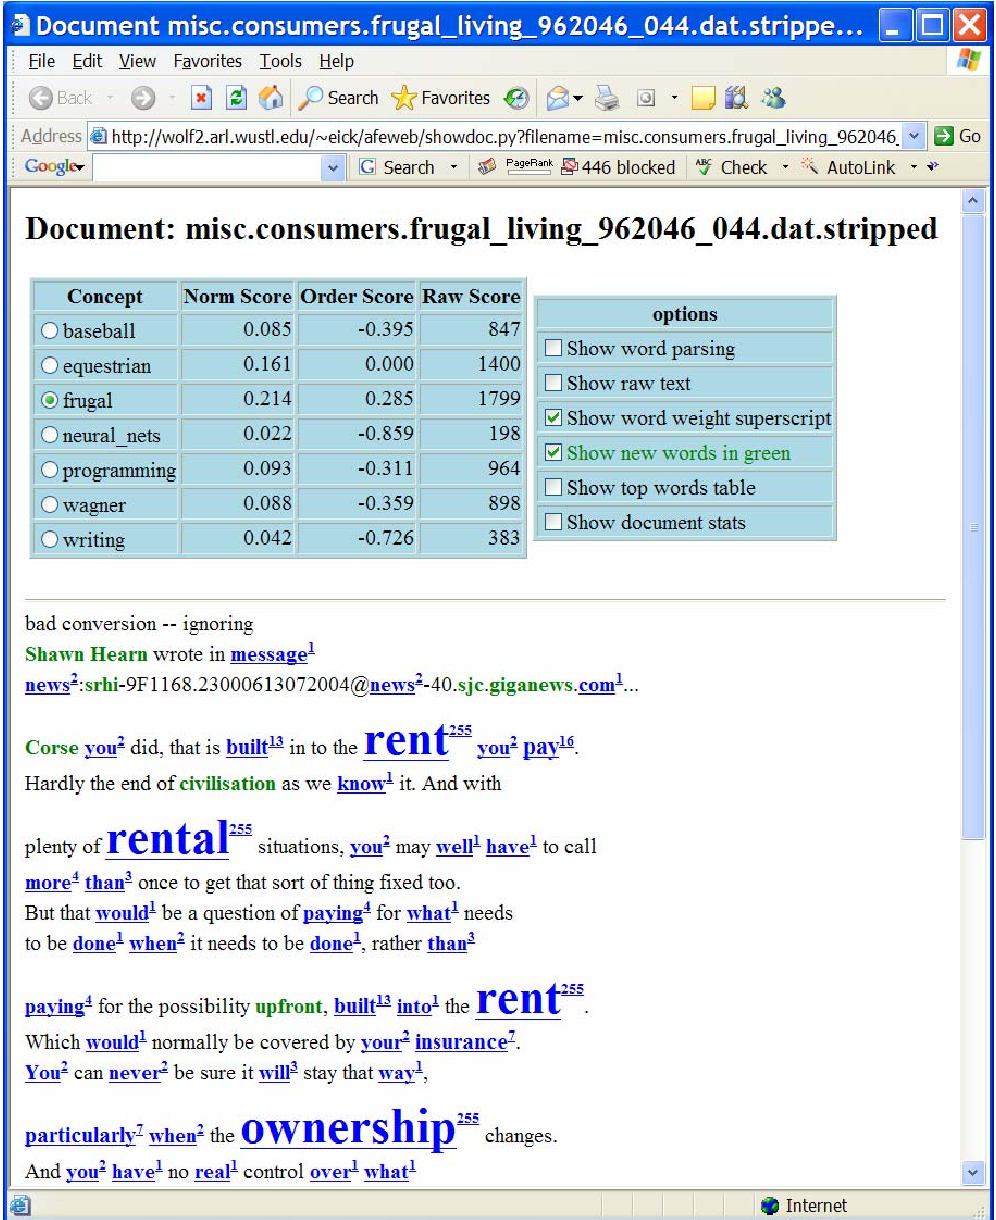
To demystify the scoring process (the dot product of document and concept vectors), AFEWeb uses a "Document Visualization" technique.
- Font Size: Larger fonts represent words with higher weights in the selected concept.
- Superscripts: Exact weight values are displayed.
- Color Coding: Green indicates "new" words not seen in training, helping identify "hash collisions" or OOV (Out of Vocabulary) issues.
Experiments & Results: Discovering the "Shooty" Bias
The system's value was proven through practical discovery rather than just numeric SOTA.
- Corpus Cleaning: By clicking on "off-diagonal" cells in the Confusion Matrix, the authors found many "errors" were actually mislabeled ground-truth data.
- Algorithm Debugging: In one case, a "baseball" classifier was found to be relying on specific usernames (like "shooty") rather than the sport's terminology. The document visualization made this immediate and obvious.
- Efficiency: The use of SVG and AJAX allowed a "thin-client" (browser) to match the performance of heavy desktop applications.
Critical Analysis & Conclusion
Takeaway
AFEWeb proves that the "Analytical Portal" model—where data stays on the backend but interactivity is handled via clever pre-computation on the frontend—is the future of research productivity. It moves NLP from "black-box testing" to "white-box understanding."
Limitations
The system is primarily optimized for centroid-based models (TFIDF/Rocchio). While the visualization principles are universal, the specific vector-space assumptions might require significant adaptation for modern non-linear models like deep Transformers.
Future Work
As language models become more complex, the need for AFEWeb’s philosophy—linking aggregate performance to individual data points—will only grow. Integrating such tools into the training loop itself could allow for "interactive training," where researchers adjust model focus in real-time.