
Beyond the List: Leveraging Social Links for Exploratory Search
Visualizing social links in exploratory search
The paper introduces a network-based visualization interface for "exploratory search" that leverages social links derived from user-generated bookmarks and tags. By utilizing the GiveALink.org dataset, the authors developed a force-directed graph system that maps semantic similarities between web resources, moving beyond the traditional linear ranked list.
TL;DR
Researchers from Indiana University have challenged the "ranked list" hegemony in search engines. By mapping the "social links" between bookmarks into a 2D interactive network, they created a hybrid interface that helps users explore unfamiliar topics with significantly fewer queries and higher satisfaction than traditional Google-style lists.
Background: Lookup vs. Exploration
Most search engines are designed for lookup: you have a specific question, and you want an answer. However, exploratory search (learning and investigative search) is different. In these scenarios, the relationship between the results is just as important as the results themselves.
Traditional interfaces fail here because a linear list only shows one dimension of relevance. This paper argues that the "Social Web" (Web 2.0) provides a rich, untapped graph of connections—bookmarks and tags—that can be used to map the "territory" of a topic.
Methodology: Mapping the Social Brain
The authors utilized GiveALink.org, a social bookmarking platform, to derive a similarity network. If many users put two websites in the same folder or tag them with the same keyword, those sites are considered semantically "close."
The Visualization Engine
The core of the methodology is a Force-Directed Network Layout.
- Proximity as Similarity: Documents are nodes; social similarities act as springs. Higher similarity pulls nodes together.
- Visual Encoding:
- Color: A "heat map" (yellow to red) indicates query relevance.
- Size: Smaller nodes indicate higher "centrality" (specificity), while larger nodes represent broader, more general resources.
- Interaction: Hovering over a node provides "details on demand," such as page titles and previews.
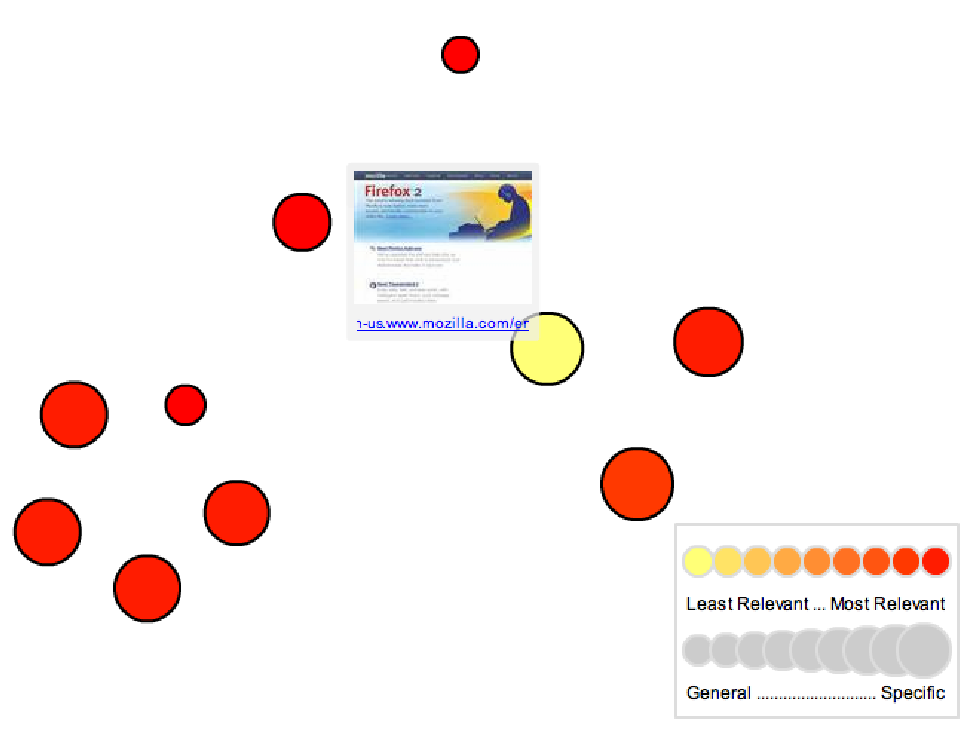 Figure 1: The network visualization applet showcasing the force-directed layout and node encoding.
Experimental Insights: Does it Actually Help?
To test their hypothesis, the team conducted a study comparing three interfaces: a pure List, a pure Map, and a Hybrid (List + Map).
1. Superior Efficiency
The most striking result was query efficiency. Users with the Hybrid interface performed significantly fewer queries per topic than those using only the list. In exploratory search, "no news is good news"—fewer queries mean the user is finding what they need through navigation and visual discovery rather than trial-and-error typing.
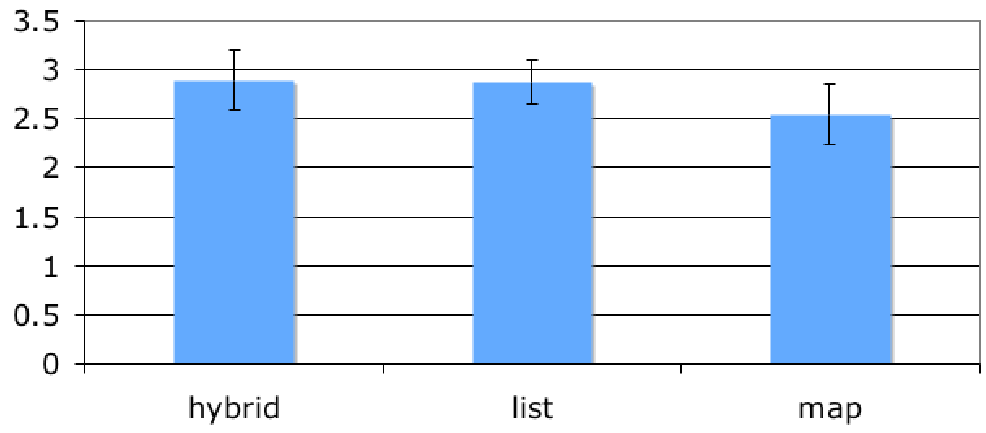 Figure 2: Statistical evidence showing lower query counts for the hybrid interface.
2. Higher Subjective Utility
Users found the Hybrid interface significantly more useful. While the quality of the search results was the same across all groups, the map provided the structural context necessary to understand how the topics were interconnected.
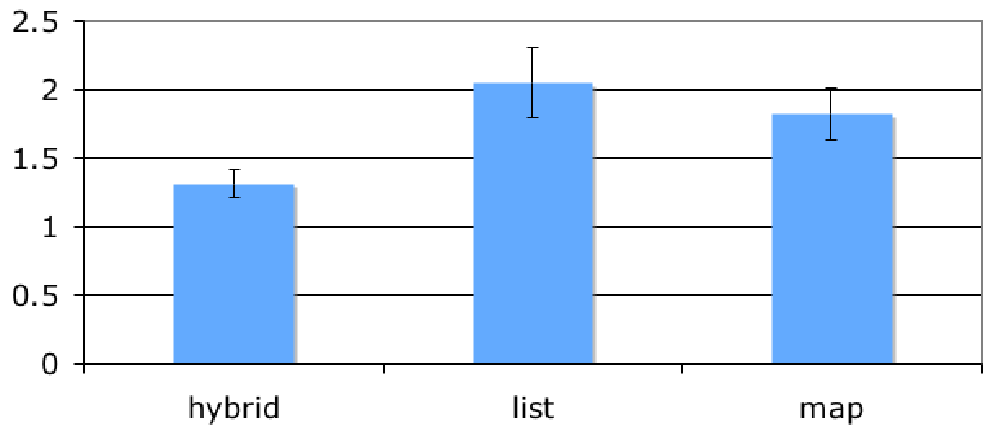 Figure 3: Ratings showing the hybrid interface was perceived as more helpful for exploration.
Critical Analysis & The Path Forward
While the paper proves that network visualization adds value, it also notes a key limitation: the lack of "snippets." Users are highly habituated to the 2-3 lines of text below a Google result. The authors intentionally removed these to control the experiment, but they admit that a production-ready system must figure out how to put text paragraphs into a dynamic 2D graph without creating visual clutter.
Takeaway for the Future: As we move into an era of AI-generated knowledge graphs, this 2008 study serves as a foundational reminder: search is not just about finding the "best" item; it's about understanding the neighborhood. The future of search interfaces likely lies in "spatial canvases" that combine the rigor of a list with the intuition of a map.
Conclusion
This work demonstrates that "social links"—the collective wisdom of how humans categorize information—provide a unique signal for exploratory search. By visualizing these signals, we can transform search from a narrow "lookup" task into a rich journey of discovery.