
Evaluating Water Infrastructure and Agriculture: A System Dynamics Approach to Drought in East Africa
Evaluating water infrastructure and agriculture practices for drought adaptations in East Africa: A combined hydrological and system dynamics approach
This study develops a combined hydrological and system dynamics model to evaluate drought adaptation policies in East Africa (the Mandera Triangle). It specifically assesses the cost-effectiveness of five hydraulic infrastructure types and two innovative agricultural practices—drip irrigation and agroforestry—aimed at improving regional socio-economic resilience.
TL;DR
Droughts in East Africa are increasing in intensity, demanding proactive policy interventions. This research presents a mathematical and computational framework that combines SWAT (Soil and Water Assessment Tool) with System Dynamics to simulate how hydraulic infrastructure and agricultural shifts (like agroforestry and drip irrigation) affect human welfare. The findings reveal that while these technologies can triple per capita income, they create high-stakes trade-offs between farmers and pastoralist groups.
Problem & Motivation: The Cycle of Reactive Relief
In the Mandera Triangle—spanning Ethiopia, Kenya, and Somalia—drought is not just a weather event; it is a systemic shock. Current interventions are largely reactive, arriving only when famine or displacement has already begun.
The author argues that the difficulty in planning lies in the interconnectedness of the system. For instance, a policy favoring crop irrigation might deplete water for livestock, causing pastoralist populations to migrate or lose their livelihoods. To solve this, we need a model that doesn't just look at "how much water is in the ground," but "how does that water move through the economy?"
Methodology: Bridging Hydrology and Socio-Economics
The research employs a dual-layered modeling approach to simulate the 537,023 km² watershed:
- Hydrological Layer (SWAT): This physical model uses topography, soil, and weather data to simulate the water cycle at the sub-basin level. It provides the "available water" input for the next layer.
- System Dynamics (SD) Layer: This is the heart of the socio-economic analysis. It uses feedback loops to model:
- Population Dynamics: Birth/death rates and environment-induced migration.
- Livestock Production: Cattle, camels, and goats, with mortality rates tied to rainfall.
- Land Dynamics: Crop yield equations for maize, beans, and sorghum based on annual precipitation.
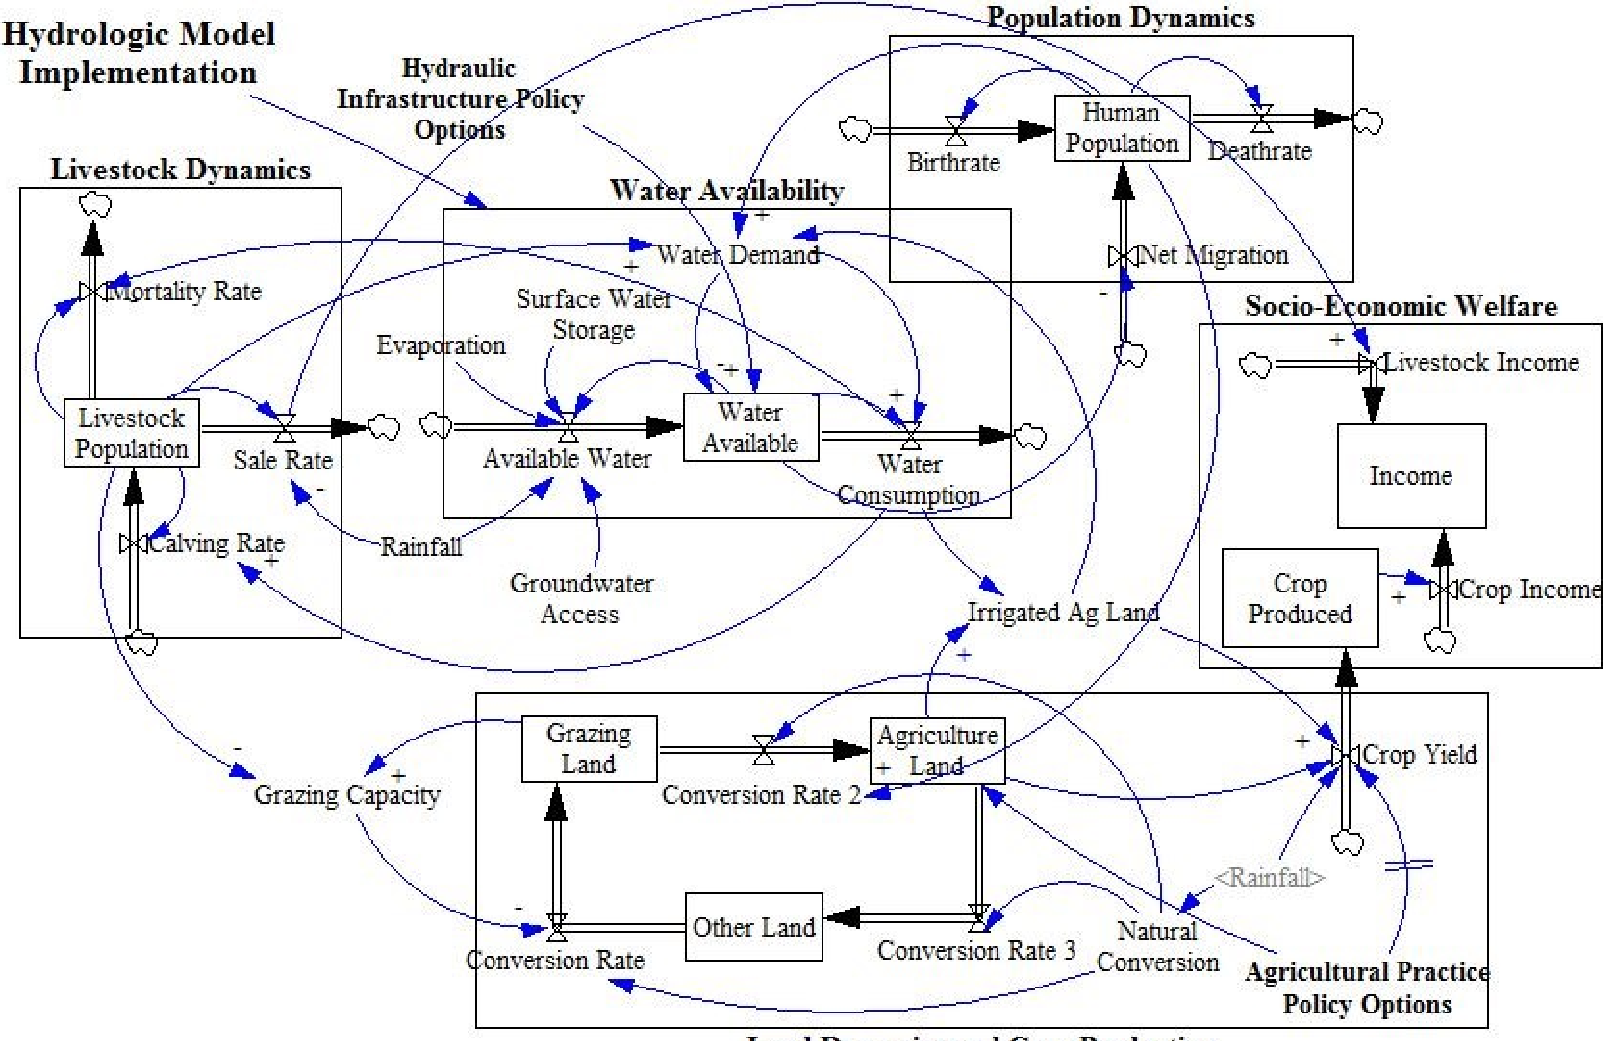 Figure 1: The causal feedback loops between water availability, population, and livestock.
Experiments & Results: The Cost of a Cubic Meter
The study evaluated five infrastructure types (Sand Dams, RWH Tanks, Ponds, Shallow Wells, and Boreholes) and two agricultural shifts.
1. Water Infrastructure Efficiency
The paper introduces a critical metric: Cost per gained cubic meter of water.
- Boreholes emerged as the winner. Despite high initial costs ($15,000), their ability to tap deep aquifers makes them the most reliable during extreme droughts.
- Rainwater Harvesting (RWH) was surprisingly ineffective at scale due to the lack of impervious surfaces (roofs) in the region to collect water.
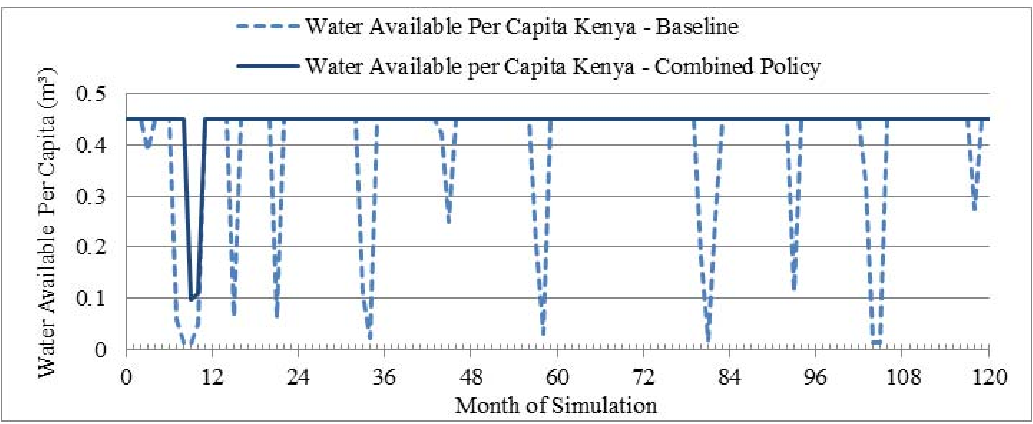 Figure 2: Total water volume added by different infrastructure types during baseline deficit periods.
2. The Drip Irrigation Dilemma
While Drip Irrigation can increase crop yields by 4x, it introduces a "negative externality." Because it creates a new, massive demand for water (up to 12,000 m³/month/km²), it competes directly with livestock consumption. In the simulations for Ethiopia, this led to a 74% decrease in pastoralist income, even as farmers' incomes soared.
3. The Long Game of Agroforestry
In contrast, Agroforestry showed a "slow but steady" benefit. Yields initially dip as trees mature and compete for nutrients, but after 3 years, the soil moisture retention and tree products (like fruit or timber) increase income by 85-128% in Kenya and Ethiopia without depleting the water table for livestock.
Critical Analysis & Conclusion
Takeaway
The study proves that a "Combined Policy" (Infrastructure + Innovative Practice) is the only way to reach near 100% water security while significantly boosting regional GNI. The transition from rain-fed to managed agriculture is the primary lever for lifting the region out of poverty.
Limitations & Future Work
The model relies heavily on historical 2001-2010 weather data. Future iterations must incorporate Climate Change projections, which predict more extreme variability than the baseline used here. Furthermore, the 38% failure rate of boreholes due to poor maintenance suggests that "hard" infrastructure must be coupled with "soft" institutional training to be sustainable.
Final Insight: Infrastructure is not a silver bullet. The "distribution of benefits" (as seen in Table V of the paper) shows that localized policy success depends on balancing the needs of the mobile pastoralist and the settled farmer.