
ETT: Engineering an Emotional Thermometer for the Virtual Classroom
Towards a Web-Based Teaching Tool to Measure and Represent the Emotional Climate of Virtual Classrooms
The paper introduces the "Emotional Thermometer for Teaching" (ETT), a web-based tool designed for online higher education to measure and visualize the emotional climate of virtual classrooms. By using a Neural Network-based sentiment analysis of forum posts, it achieves an F1-score of 0.76 in classifying student emotions into positive, negative, and neutral categories.
TL;DR
In the isolated world of e-learning, instructors often fly blind regarding their students' morale. The "Emotional Thermometer for Teaching" (ETT) project bridges this gap by using NLP and Neural Networks to analyze forum posts, transforming text data into a real-time visualization of a classroom's "emotional climate." With an F1-score of 0.76, it provides a non-intrusive way for teachers to detect when to step in and offer support.
The "Emotional Blind Spot" in Online Education
Traditional classrooms offer immediate visual and auditory feedback—a furrowed brow or a frustrated sigh tells a teacher to slow down. In virtual environments, this "emotional bandwidth" is lost. Current LMS platforms focus on cognitive metrics (grades, login times) but ignore the affective factors—boredom, anxiety, and pride—that Pekrun's research identifies as critical drivers of academic success.
The authors argue that without this awareness, the role of the teacher as a "coach" is crippled. The challenge lies in capturing these emotions without resorting to invasive sensors or tedious surveys that interrupt the learning flow.
Methodology: From Syntax to Sentiment
The ETT system operates on a three-tier architecture: Data Extraction, Machine Learning Classification, and Visual Representation.
1. The Feature Engineering Pipeline
Instead of simple keyword matching, the team utilized several sophisticated NLP indicators:
- TF-IDF Weighted Word Relevance: Focusing on nouns, adjectives, and verbs with high emotional connotation.
- Text Particles: Measuring the "stress" in writing through multiple punctuation marks (e.g., "???") and ellipsis.
- Polarity Weighting: Calculating the relative expressiveness of words based on a manually tagged training set of 700 posts.
2. Model Selection
The researchers compared several supervised learning models using k-fold cross-validation.
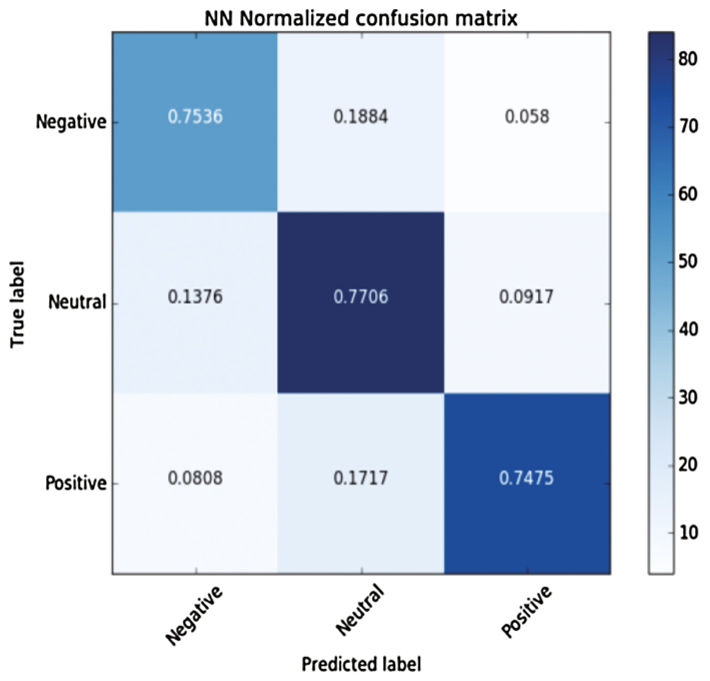 Figure 1: Confusion matrices comparing Neural Networks and Support Vector Machines.
The Neural Network emerged as the winner with an F1-score of 0.76, showing superior ability to distinguish between subtle neutral and negative tones compared to Random Forest or SVM.
Real-Time Visualization: The "Thermometer"
The core innovation is the web dashboard. Built with Django and C3.js, it provides a temporal view of the classroom's mood.
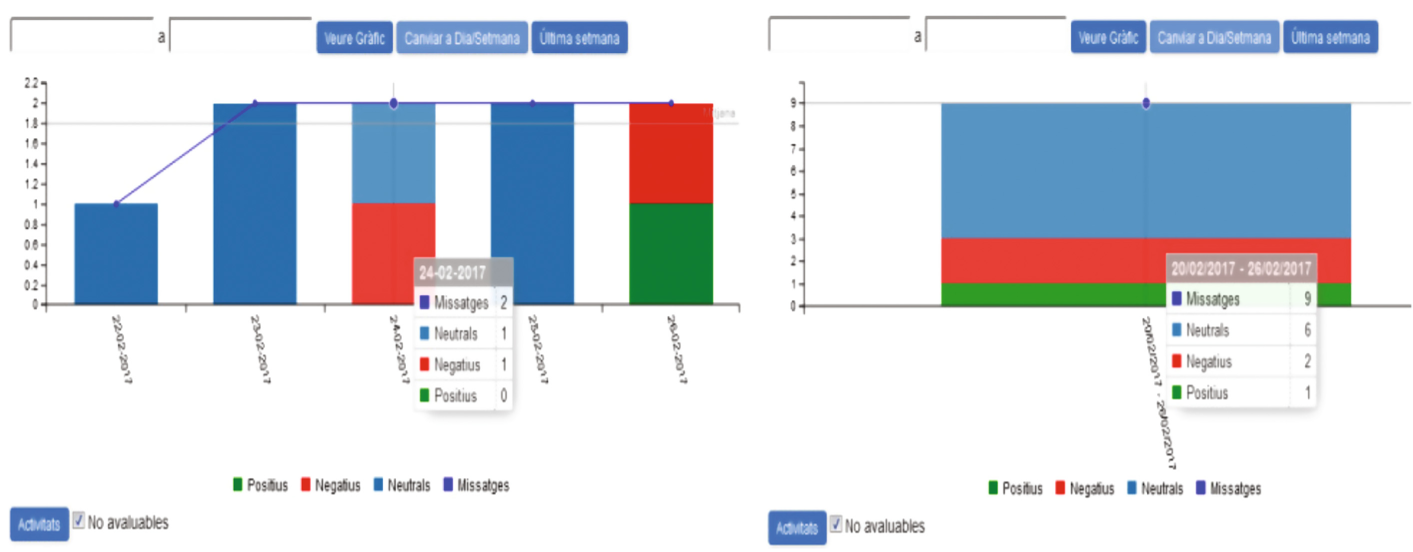 Figure 2: The ETT Dashboard showing the evolution of positive, neutral, and negative emotions.
This visualization allows for Just-in-Time interventions:
- Negative Spike Detected: The lecturer sends hints for a difficult assignment.
- Neutral Plateau: The lecturer might introduce a social activity to boost engagement.
- Positive Trend: The lecturer acknowledges the hard work, reinforcing the positive loop.
Critical Insight & Future Outlook
While the ETT tool currently relies on manual feedback to avoid the "unintentional negative consequences" of AI-led intervention, its value as a diagnostic tool is immense.
Limitations: The current model relies on forum posts. In modern classrooms where interaction happens via chat or video, this text-heavy approach might miss a significant portion of the "hidden" emotional state.
Future Work: The authors plan to integrate "Academic Analytics"—tracking navigation patterns and session times—to complement the sentiment data. This multimodal approach (combining what students say with what they do) represents the next frontier in building empathetic, intelligent learning environments.
Conclusion
The ETT project is a significant step toward "Affect-Aware" LMSs. By treating the classroom as a living emotional ecosystem rather than a collection of data points, it empowers educators to regain the "human touch" that is so often lost in the digital divide.