
Who Drives Data? The Dark Side of Data-Driven Governance in Rural India
466_Who drives data in data-driven governance The politics of data production in India's livelihood program.
This paper investigates the socio-political dynamics of data production in India's MGNREGA livelihood program, revealing how digital information systems are manipulated by local power elites. Through a six-month ethnographic study, the authors demonstrate that high-quality digital "metadata" often masks large-scale ground-level inaccuracies and systemic exclusion.
TL;DR
While "data-driven governance" is the modern mantra for transparency, this research uncovers a startling reality: in rural India, digital data is often "manufactured" by local elites. Using a deep ethnographic dive into the MGNREGA program, the authors reveal how a technically perfect Management Information System (MIS) can hide systemic corruption, where machinery replaces people, and "fake" participants fill the databases.
Academic Positioning: This work transitions the conversation from Data Access (who can see the data) to Data Production (who controls the input), situating itself as a critical pillar in the field of Data Justice.
Problem & Motivation: The Illusion of Accuracy
Policy-makers today rely on dashboards like "Disha" and real-time MIS to monitor welfare effectiveness. The underlying assumption is Accuracy: that the recorded value conforms to the real-world value.
However, the authors argue that "data is the lifeblood of decision-making," but if the blood is poisoned at the source, the decision-making is fatally flawed. Existing literature focuses heavily on the "Data Divide" or "Visual Literacy," but rarely questions the mundane bureaucratic act of a clerk typing a number into a computer. The mission of this paper is to peel back the layer of "digital legibility" to see the political "messiness" underneath.
Methodology: The Data Life-cycle
The researchers mapped the path of data from its initial system design through to its ultimate use by citizens and policy-makers.
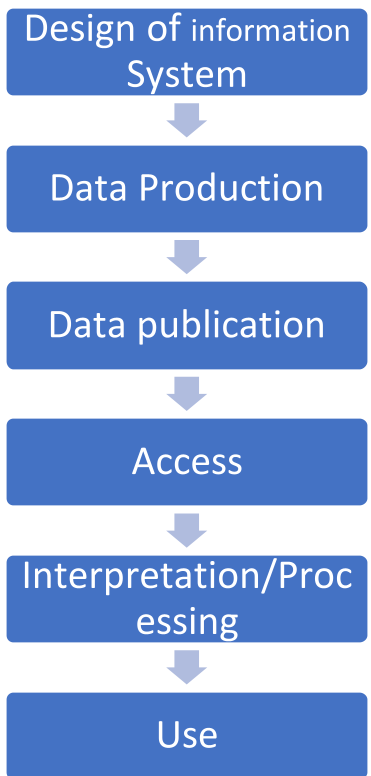
The core methodology involved 6 months of immersion in Gram Panchayats (village councils) in Karnataka. By shadowing "Social Audit" teams and observing Data Entry Operators (DEOs), the researchers moved beyond theoretical critique to witness the actual politics of the keyboard.
Methodology Detail: The MGNREGA Workflow
MGNREGA is designed to be "demand-driven"—a citizen asks for work, and the digital system records it.
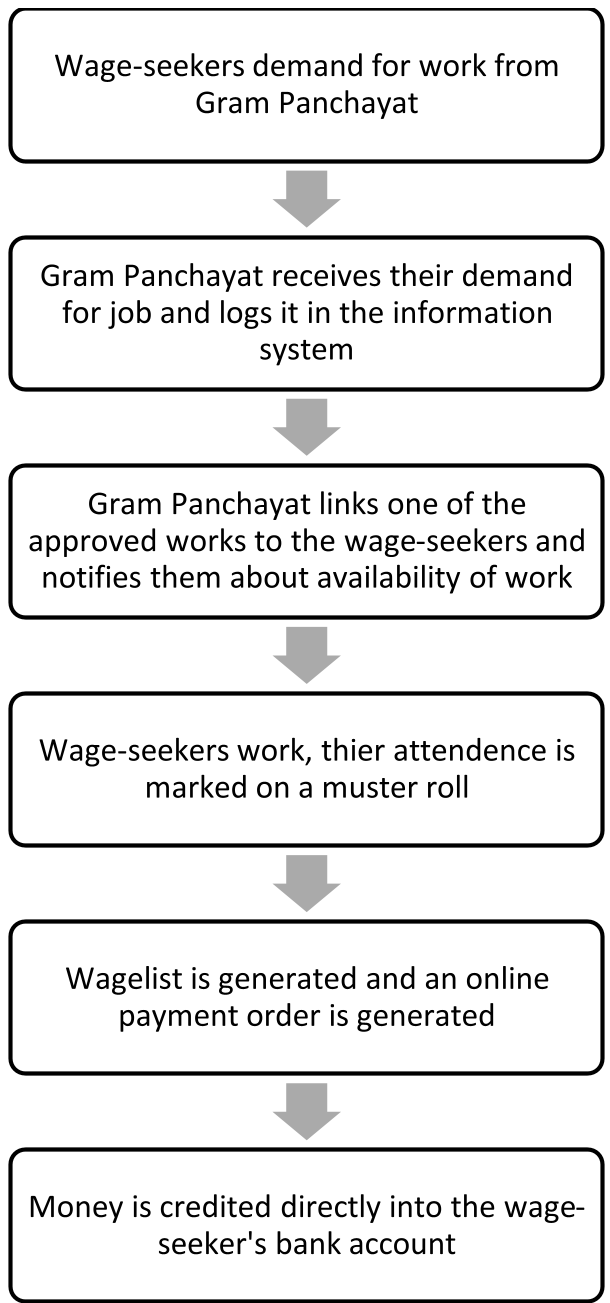
In theory, the Data Entry Operator (DEO) acts as a neutral bridge. In practice, the researchers found that local political leaders ("The Elite") dictate whose names are entered, turning the system into a tool for collusive corruption.
Experiments & Results: The "Machinery" of Corruption
The most striking finding was the economic disparity between actual work and recorded work. Local leaders would use earth-moving machinery (prohibited by the program) to finish a project quickly and cheaply, then input dozens of names of people who never worked to claim the "manual labor" budget.
Comparative Cost Visualization (Conceptual Table)
| Activity | Recorded (Manual) | Actual (Machine) | Siphoned "Profit" |
|---|---|---|---|
| Expenditure | ~300,000 Rs | ~35,000 Rs | ~265,000 Rs |
Key Findings:
- Social Injustice: 87% of "official" participants in a sampled area had no idea they were in the system.
- Managed Timeliness: The system showed 100% promptness in providing work, but interviews revealed that actual wage-seekers were routinely ignored unless they were "loyal" to local leaders.
- Elite Capture: The "Data Drivers" are not the citizens, but the "Venkatappas"—local leaders who invest their own money upfront to pay for machinery, viewing the digital welfare system as a private investment opportunity.
Critical Analysis & Conclusion: Widening the Lens
The paper concludes with a sobering takeaway: Digital data does not eliminate power; it provides it with a new language.
Takeaway for AI & GovTech Practitioners:
- Accuracy vs. Timeliness: A dashboard that updates in real-time is useless if the input is fraudulent. We must prioritize "Ground-Truth Verification" over "Real-Time Visualization."
- Data Justice: We must look at "Data Production" as a political act. Design needs to involve counter-power mechanisms (like independent social audits) to challenge the data entered by officials.
Limitations: While the ethnographic evidence is compelling, the study is localized to Karnataka. However, the mechanism of "elite capture" is a documented global phenomenon in public service delivery.
Future Outlook: The authors call for "Policy Innovations" where data production processes are participatory. Until then, "data-driven governance" may remain an exercise in looking at a map that has little to do with the actual territory.