
Mapping the Digital Commons: How Social Network Analysis Reveals the Hidden Structure of Science in Wikipedia
The implications of Wikipedia for contemporary science education: Using Social Network Analysis Techniques for Automatic Organisation of Knowledge
This paper applies Social Network Analysis (SNA) techniques to the Spanish Wikipedia to automatically organize scientific knowledge. By representing over 1 million articles as nodes and their hyperlinks as edges, the authors utilize the InfoMap community detection algorithm to identify 1,315 clusters, successfully isolating scientific and technological content from the broader network.
TL;DR
Researchers have moved beyond simple keyword searches to map the "DNA" of the Spanish Wikipedia using Social Network Analysis (SNA). By analyzing over 30 million hyperlinks, they identified that while science makes up about 11.66% of the platform's core content, its organization follows community-driven logic rather than traditional textbook hierarchies. The result is a fascinatng look at how digital collaboration shapes our collective understanding of science.
Problem & Motivation: The Chaos of 50,000 Categories
Wikipedia is the world’s largest classroom, yet its organizational structure is essentially a "folksonomy"—a messy, user-generated labeling system. For educators, this poses a challenge: How do we know if a scientific field is well-represented if the categories are overlapping, redundant, or purely administrative?
The authors argue that the true structure of Wikipedia lies not in its labels (Categories), but in its hyperlinks. These links represent a "semantic endorsement" by editors, connecting related concepts. To uncover the real scientific map, the researchers looked at Wikipedia as a massive directed graph.
Methodology: The InfoMap Approach
The study analyzed a snapshot of the Spanish Wikipedia consisting of 1,027,168 articles and 30,007,372 links. To make sense of this data, they employed the InfoMap algorithm, which discovers communities by simulating how information "flows" through the network.
1. Structural Pruning
The team first identified the "Giant Component"—the 85.5% of articles that are interconnected. They noticed a "long tail" phenomenon where a few large communities held the vast majority of knowledge.
2. Identifying "Real" Content
A significant portion of scientific Wikipedia (nearly 58,000 articles) consists of "taxonomic stubs"—near-empty pages for plant species or asteroids created by bots. The researchers distinguished these from "elaborate content" to find the true weight of scientific writing.
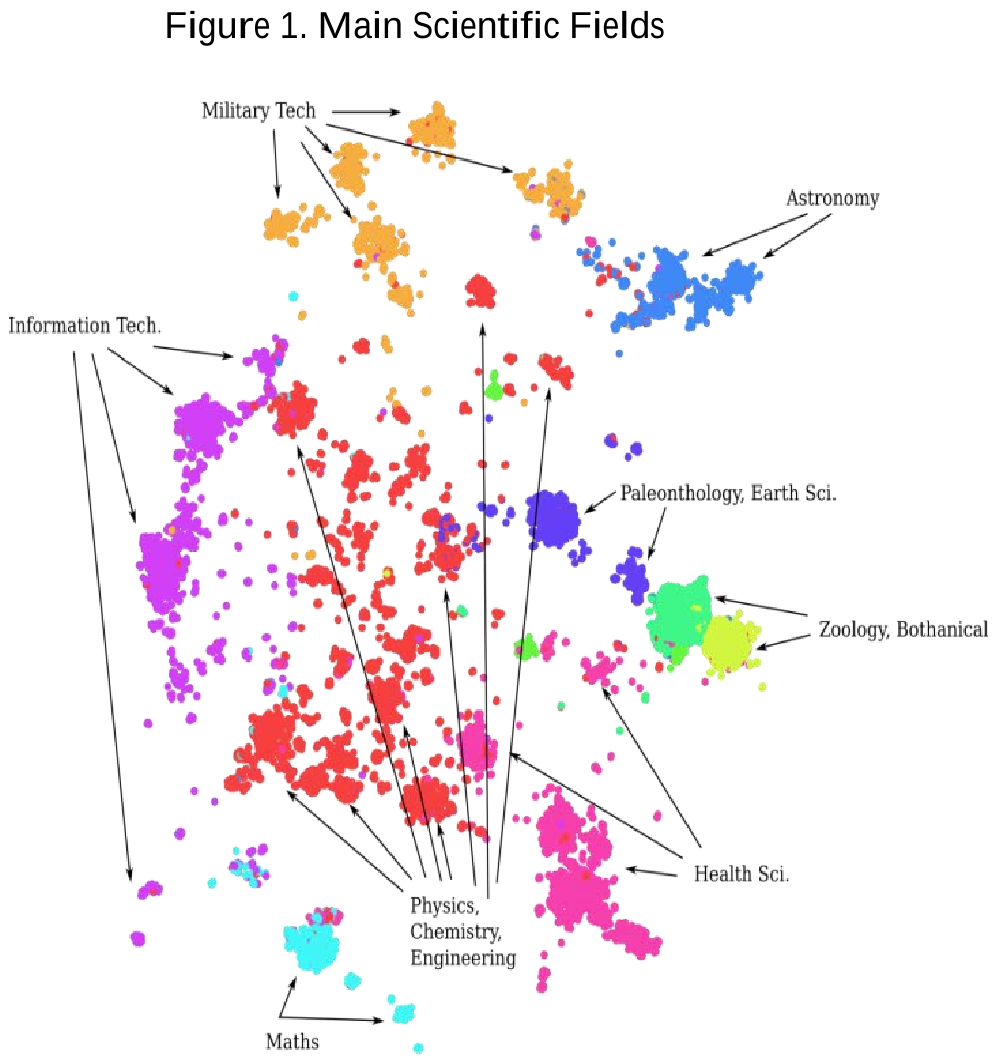 Figure 1: This force-directed map shows the spatial arrangement of scientific clusters, where link density dictates proximity.
Experiments & Results: A New Scientific Hierarchy
The SNA revealed 10 major scientific communities. Interestingly, these don't always align with the "Seven Liberal Arts" or standard university departments.
Key Insights by Field:
- The Power of Botany & Zoology: These are the largest clusters by article count, primarily due to the platform's obsession with classification.
- Mathematical Cohesion: While Mathematics had the fewest articles (3,039), it had the highest link density (0.0049), making it the most internally consistent and interconnected scientific field.
- The "Grey's Anatomy" Effect: Scientific articles rarely link to non-science content, but when they do, it's often to "transversal" topics like dates or countries. Amusingly, the TV show Grey’s Anatomy emerged as one of the most linked non-scientific nodes within health science clusters, highlighting the cultural intersections of knowledge.
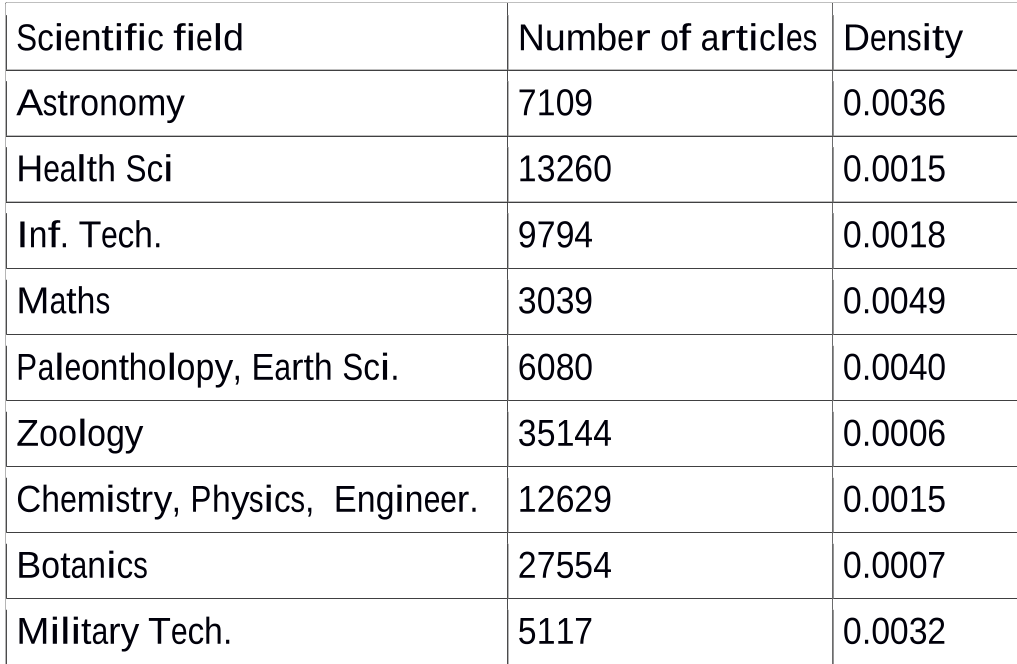 Table 1: Density and size of major scientific subfields identified via modularity analysis.
Critical Analysis & Conclusion
This work demonstrates that Network Topology is a more robust indicator of knowledge organization than manual tagging. However, the study also highlights a limitation of Wikipedia: the dominance of "stub" articles. While the quantity of science is high (17.3%), the quality (elaborate content) is lower (~11%).
Takeaway for Contemporary Education:
Wikipedia doesn't just mirror science; it filters it through the lens of its contributors. The high density of Mathematics and Palaeontology suggests these communities are more active in cross-referencing their work, whereas Military Technology relies heavily on standardized units of measurement. For educators, understanding these link-based "neighborhoods" can help identify which scientific topics are robustly supported and which are isolated islands of information.
Future Outlook: Integrating these SNA techniques into Wikipedia's interface could allow for "automatic knowledge maps," helping students navigate complex scientific terrain through visual relationships rather than just alphabetical lists.