
Uncovering the Pulse of LBSNs: A Deep Dive into Apontador's Workload
Workload characterization of a location-based social network
This paper presents a comprehensive workload characterization of Apontador, a major Brazilian Location-Based Social Network (LBSN). By analyzing 64 million HTTP requests, the study establishes statistical models for user sessions, request arrivals, and object popularity, providing a foundational understanding of how LBSN traffic differs from traditional Web 1.0 and 2.0 systems.
TL;DR
This study provides the first server-side characterization of a Location-Based Social Network (LBSN). By analyzing the Brazilian service Apontador, researchers discovered that LBSN users stay active three times longer than traditional web users and consume content that is far less "viral" and much more "local," following a Log-normal popularity distribution rather than the classic Zipf’s law.
Perspective: Why LBSNs Change the Game
In the traditional Web 1.0 era, a few "blockbuster" pages accounted for the vast majority of traffic. This made caching easy: keep the top 1% of objects in memory, and you solve 90% of your performance woes. However, LBSNs like Foursquare and Apontador introduce a spatial constraint. Interactions are tied to physical coordinates. This paper asks a critical question: How does this "physicality" change the digital footprint of the system?
Methodology: Mapping the Clickstream
The researchers analyzed a dataset of over 64 million HTTP requests over a one-month period. To bridge the gap between digital logs and physical reality, they used a Python-based crawler to extract latitude, longitude, and category data for 2.6 million unique locations.
Defining the "Session"
A key contribution of this work is the empirical definition of an LBSN session. By testing various "session expiration times," they found that the number of sessions stabilizes at the 30-minute mark.
- Finding: LBSN sessions are significantly longer than the 10-minute average of the 1998 World Cup logs, likely because users spend more time interacting with maps, reading reviews, and examining location details.
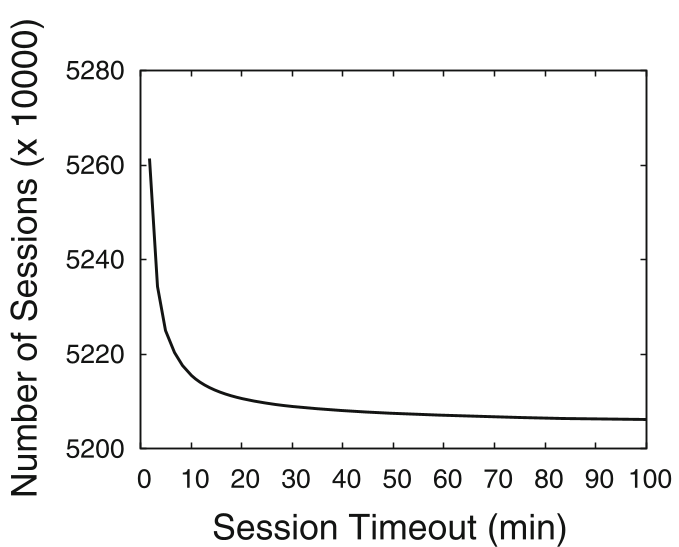 Figure 1: Determination of the 30-minute session timeout via stability analysis.
The "Flatter" Popularity: Goodbye Zipf, Hello Log-normal
Perhaps the most striking finding is the popularity distribution of locations. In typical Web environments, popularity follows a Power Law (Zipf). In LBSNs, it follows a Log-normal distribution.
- The Intuition: Social ties and physical distance act as "inhibitors" to extreme popularity. While a YouTube video can be viewed by anyone globally, a local bakery in São Paulo is primarily relevant to people nearby.
- Data Evidence: 10% of objects in the 1998 World Cup concentrated 97.18% of accesses. In contrast, 10% of locations in Apontador received a much smaller fraction of total traffic.
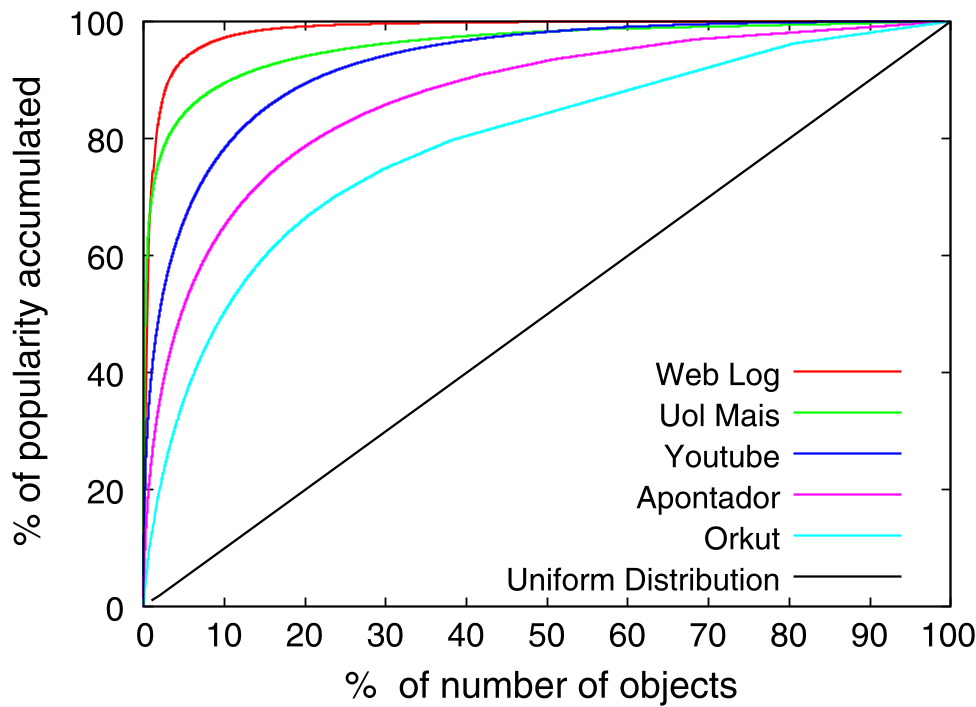 Figure 2: Normalized accesses showing the "flatter" popularity of LBSNs (Apontador) compared to the World Cup Web server.
Spatial Navigation Patterns
The study also looks at how users move digitally between physical locations.
- Temporal Patterns: Traffic peaks during the day and drops by 50% on weekends/holidays, reflecting the "utility" nature of the service (finding services during work/commute hours).
- Geographic Proximity: 50% of consecutive location views in a session are within 18km of each other. Interestingly, when users browse within the same category (e.g., looking at different restaurants), the distance between those locations is even smaller.
Critical Insight: The Infrastructure Challenge
The "flattening" of the popularity curve is a warning for system architects. If content is less concentrated, traditional caching becomes less effective.
The authors argue that the "Future Internet" must be designed with Locality of Interest at its core. If most interactions happen between users and objects within a 20km radius, servers and caches should be distributed geographically to match these clusters, rather than relying on a few massive central hubs.
Conclusion
This paper serves as a bridge between social science and systems engineering. It proves that our physical behavior (where we go) directly shapes the mathematical properties of the networks we use. For developers of modern geo-apps, the takeway is clear: your workload is not just a stream of bits; it's a map of human movement.
Limitations: The study notes that some extremely long-distance sessions (1,000km+) are likely contaminated by bots or search engine crawlers, which remain a challenge for clean workload characterization in open Web systems.