
XSS Worms in Social Networks: Turning Topology into a Defensive Shield
A Study of XSS Worm Propagation and Detection Mechanisms in Online Social Networks
This paper presents a comprehensive study on the propagation dynamics of XSS worms within Online Social Networks (OSNs) and proposes resource-efficient selective monitoring schemes. By analyzing structural properties like community clustering and user behaviors, the authors demonstrate how these factors naturally slow down worm spread and leverage "well-cross-connected" nodes for highly effective malware detection.
TL;DR
Online Social Networks (OSNs) are fertile ground for XSS worms like the infamous "Samy." This paper moves beyond expensive, exhaustive post-scanning by proving that OSN structural properties—specifically community clustering and friend-centric browsing—actually slow down worm propagation. By strategically monitoring a handful of "bridge" users (Cross-Clique Connectivity), we can detect global outbreaks with 80x higher efficiency than random sampling.
The Motivation: Why Exhaustive Scanning Fails
Large-scale platforms like Facebook process billions of read/write operations daily. Even for a tech giant, checking every single post for malicious payloads is a massive computational burden. Historically, worm propagation models focused on computer networks, but OSNs are different:
- The Trust Bias: You are much more likely to visit a friend's profile than a total stranger's.
- Community Clustering: OSNs aren't random; they are made of dense "cliques" connected by sparse bridges.
The authors realized that if we understand how these structures naturally "quarantine" worms, we can design smarter, leaner detection mechanisms.
Methodology: Deciphering the Network "Brakes"
The researchers identified three primary factors that act as natural inhibitors to XSS worm spread:
- Visiting-Friends Probability (): When users mostly navigate within their friend circles, the worm gets trapped in a "local loop," circulating among specific groups before it can leap to the wider network.
- Clique Sizes: Small, numerous communities act as biological barriers. The more fragmented the network into small cliques, the harder it is for a worm to achieve a "global" pandemic status.
- Clustering Coefficient: The paper proves that a highly clustered OSN propagates worms slower than an equivalent random graph because the malware is redundant within a community before it exploits an outgoing link.
The Strategy: Selective Monitoring
Instead of monitoring everyone, why not monitor the "super-spreaders" or "neighborhood watch" nodes? The authors compared 5 metrics to select these candidates:
- Node Degree: The most socialites (highest friend count).
- Closeness/Betweenness: Nodes that sit on the shortest paths between others.
- PageRank: Nodes with high "influence" likelihood.
- Cross-Clique Connectivity (The Secret Sauce): Nodes that belong to multiple distinct communities.
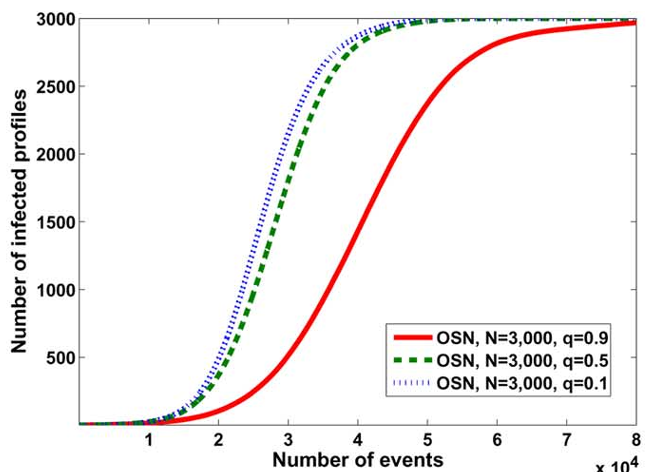 Figure 1: Illustration of why high cross-connectivity is vital—users in multiple cliques act as the primary gateways for worm transmission.
Experiments & Results: Efficiency Redefined
The simulation results are striking. In a network of 100,000 nodes, selecting just 15 strategic candidates to monitor (and their immediate friends) led to detection after roughly 33 infections. In contrast, selecting 15 nodes randomly allowed the worm to infect over 2,400 users before detection—a 75x to 80x difference in effectiveness.
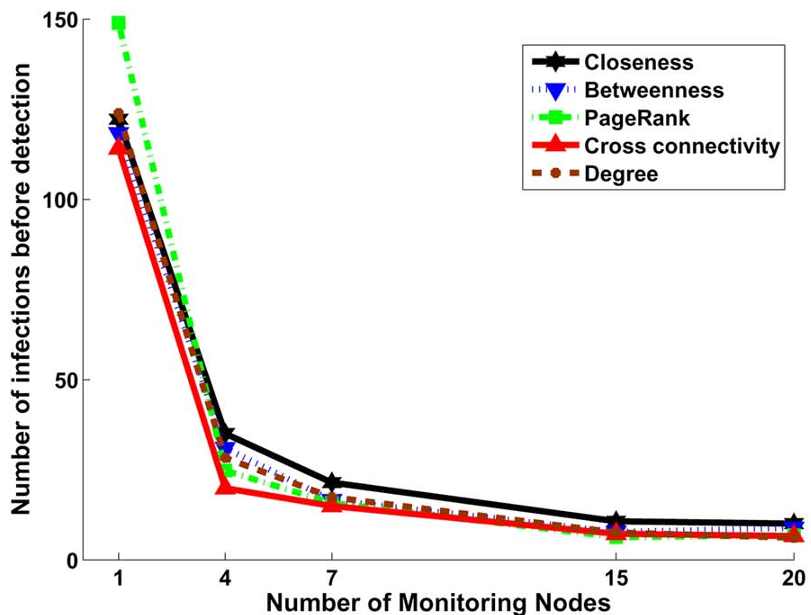 Figure 2: Performance comparison of various metrics. Notice how Cross-Clique Connectivity and PageRank consistently yield the lowest infection counts before detection.
Key Insights:
- Metric Overlap: In large networks (100k+), the top candidates for PageRank, Degree, and Cross-Clique Connectivity often overlap by 95%.
- Computational Trade-off: While "Betweenness" is mathematically elegant, it is computationally expensive (). Node Degree and PageRank offer the "best of both worlds"—they are fast to compute and nearly as effective as the most complex metrics.
Critical Analysis & Conclusion
The value of this work lies in its Inductive Bias—it uses the existing social fabric to protect the network. Rather than fighting the massive volume of data, it filters it based on local transitivity.
Limitations:
- Directed vs. Undirected: The current study focuses on mutual friendships (like Facebook). Propagation on directed networks (like Twitter/X) might be more aggressive as the "follow" relationship isn't always reciprocal.
- Static Topology: Real-world networks are dynamic; edges appear and disappear. The "candidates" might need frequent re-calculation.
Future Outlook
This research paves the way for "Security-as-a-Service" where OSNs can apply rigorous, power-demanding scanning techniques (like full JavaScript de-obfuscation) on a tiny, high-risk subset of traffic rather than skimming the surface of all traffic. For future OSN architectures, the lesson is clear: Network topology is not just a feature of sociality; it is a fundamental tool for cybersecurity.