
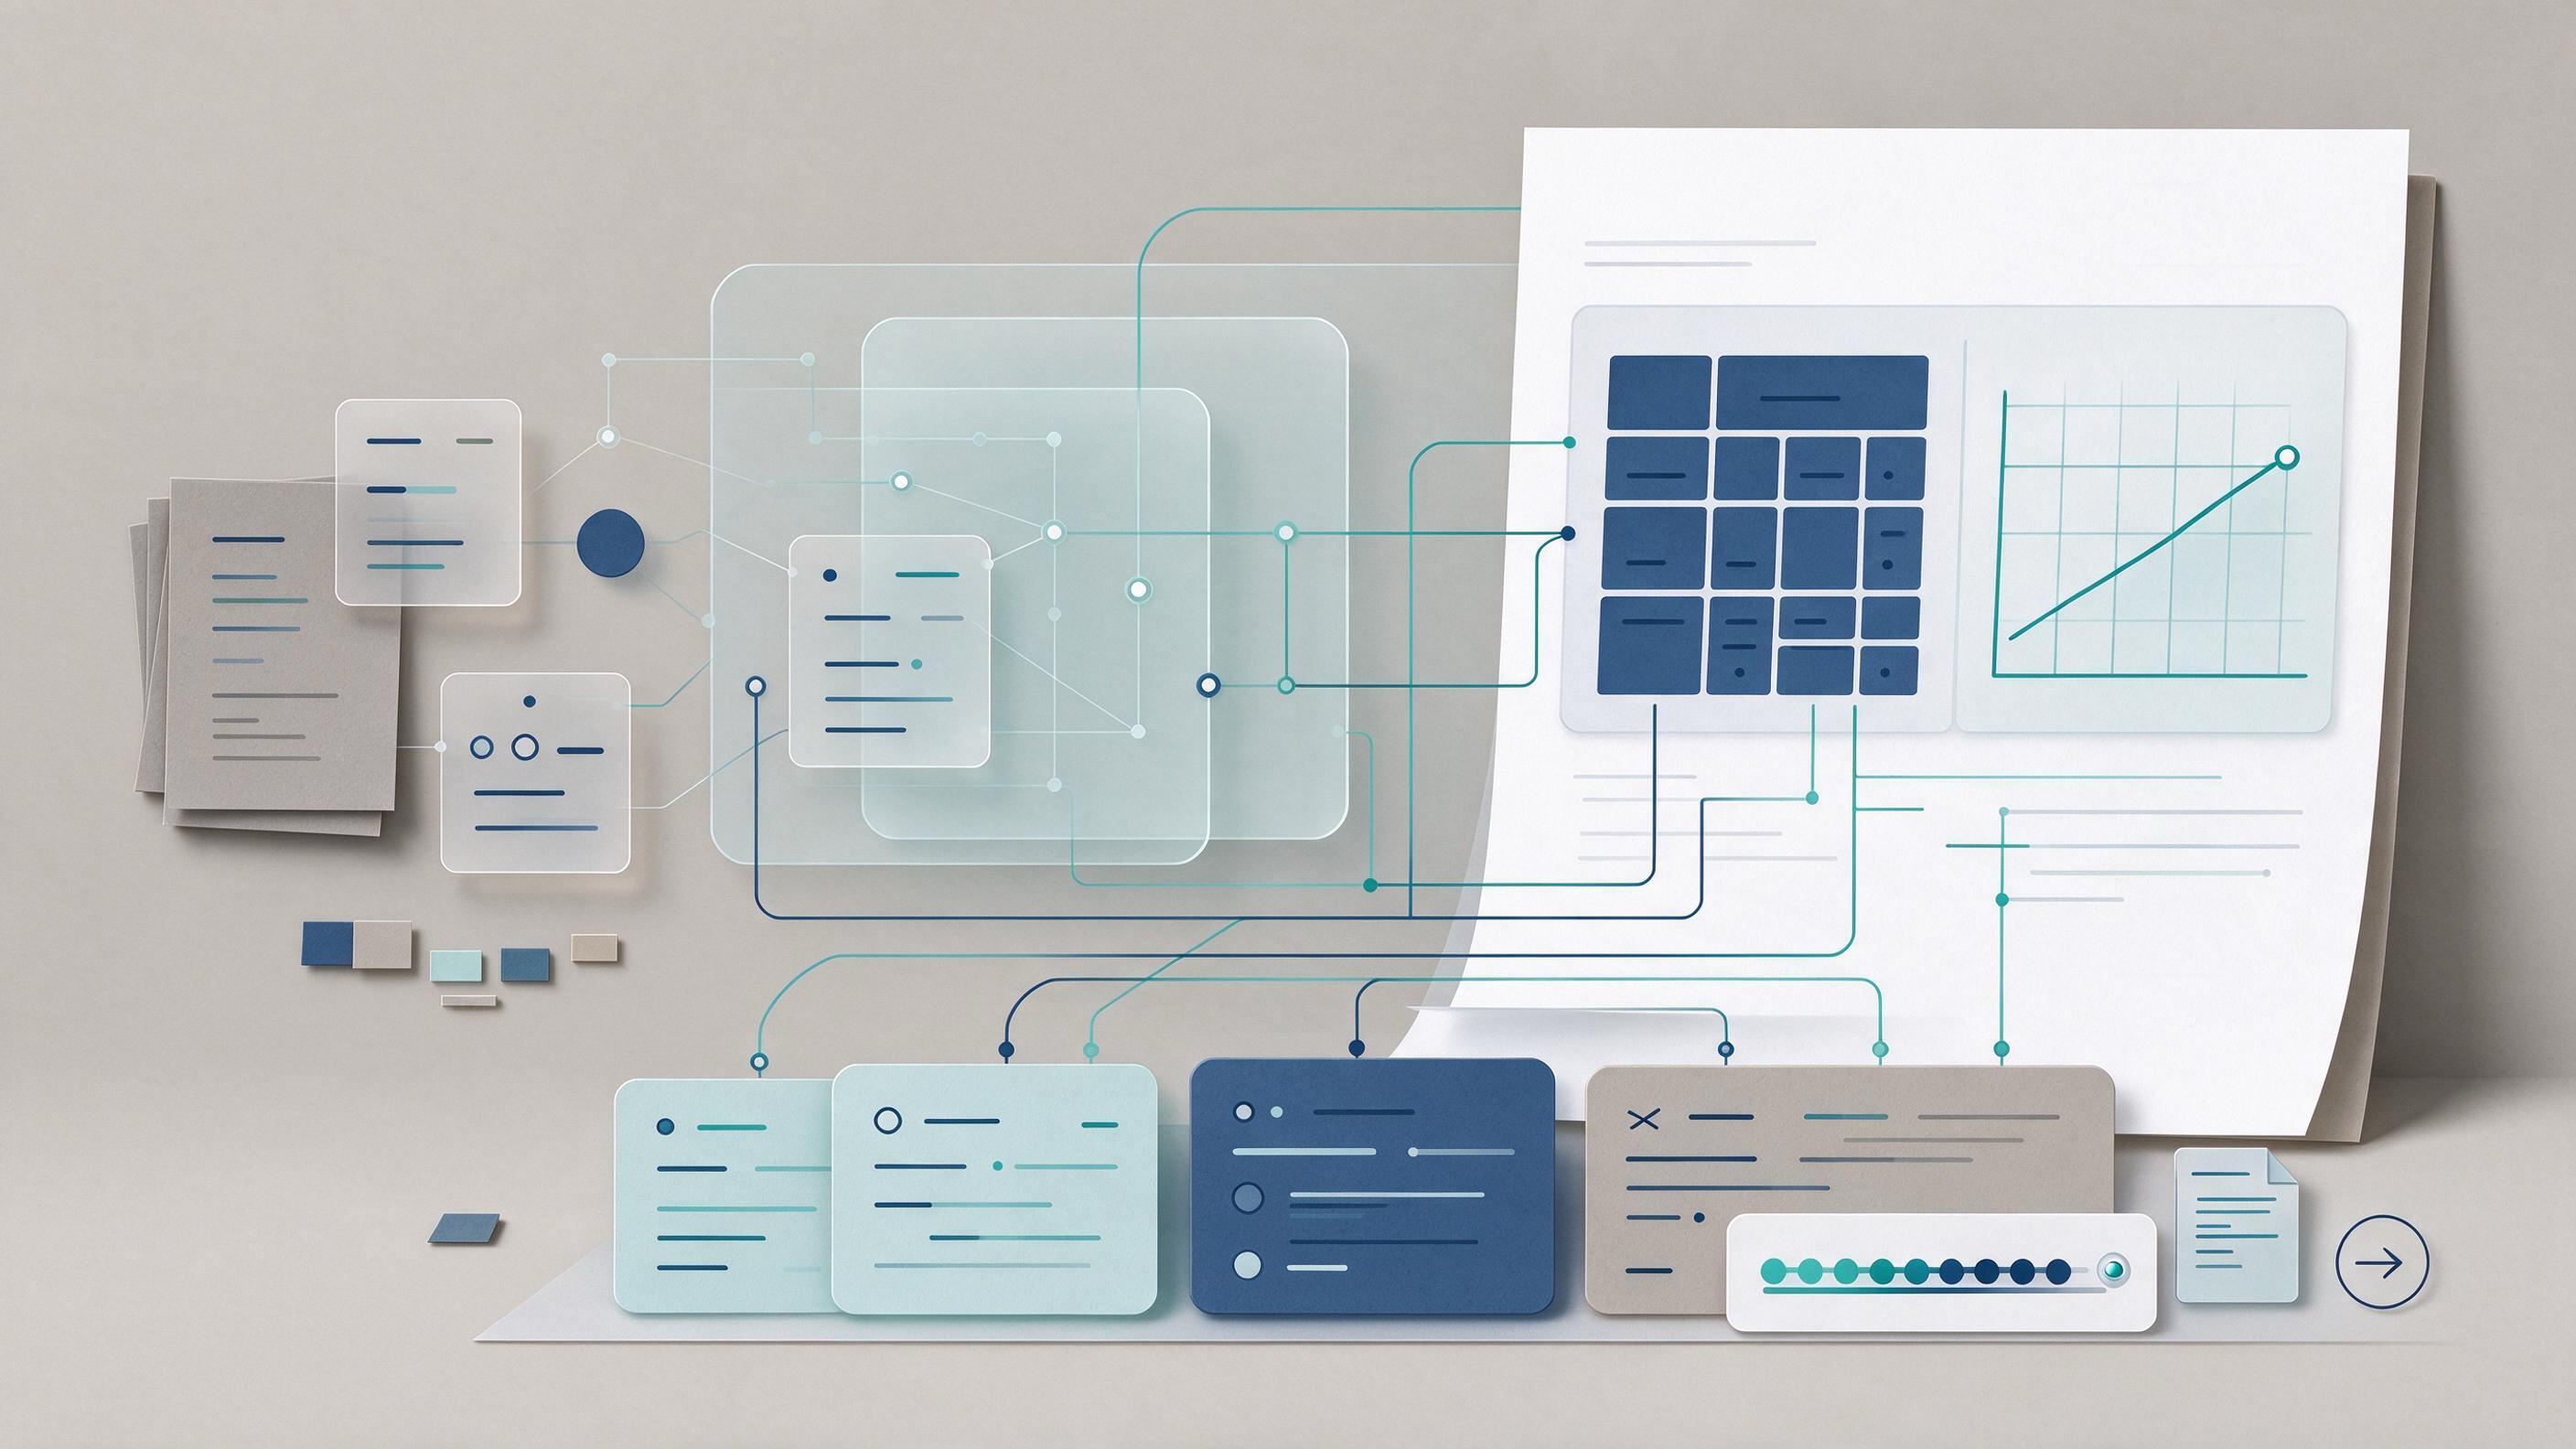
Most teams do not fail on tables and figures because their data is weak. They fail because the visual evidence does not survive handoff: an analyst builds a chart in a notebook, a reviewer asks where a number came from, and nobody can reconstruct the path from a source table to the published figure. This guide treats tables and figures as traceable evidence objects rather than decoration. It walks through the decisions that matter before submission, shows how to organize the underlying sources while you build them, and gives you a concrete way to know when a visual is ready to leave your team.
Where do tables and figures usually go wrong?
Diagnose the starting state before changing anything. Across research and analysis teams, the failure modes cluster into four patterns.
| Starting state | Typical symptom | First fix |
|---|---|---|
| One-person workflow | A chart exists only inside a script or slide file; nobody else can reproduce it | Move the chart's source query and data snapshot into a shared, named location |
| Multi-source report | Two figures cite overlapping sources inconsistently | Create one source register per paper or deliverable |
| Review-heavy environment | Reviewers spend more time hunting for raw numbers than judging the argument | Attach a per-figure evidence note before sending for review |
| Year-end or closeout reset | Old decks are unreadable six months later because links and files moved | Link each figure to a persistent identifier and archived metadata, not a local path |
If you recognize one of these, you do not need a style guide first. You need a retrieval workflow. A DOI illustrates why: a persistent identifier can remain stable when the location or descriptive metadata of an object changes. A table or figure deserves the same treatment inside your own project. Give every visual a stable identifier, a source record, and a confidence note before you worry about font size.
What should you decide before building any table or figure?
The first decision is not chart type. It is what question the visual must answer for the reader.
For each planned table or figure, record four things:
- The subquestion it answers. Example: "Did enrollment differ between treatment arms at baseline?" not "Baseline characteristics."
- The source or sources it draws from. Name the underlying study, report, dataset, or query.
- The unit of analysis. Rows are participants, sites, months, model runs, or something else.
- The reader action. What should someone do after seeing it: accept a comparison, flag a risk, or request the raw file?
A useful artifact here is a one-page visual plan. For a client deck or decision memo, list every planned exhibit with these four fields. Teams working in WisPaper Research Projects can keep this plan next to the source papers, so the exhibit plan and the evidence stay in one project view rather than in separate chat threads or slide comments.
This step also determines what you need to search for. Cochrane's guidance for systematic work is transferable to any evidence-based deliverable: plan searches from your eligibility criteria, search multiple sources, and document the process. If your figure needs baseline data from a specific trial report, say so in the plan. That makes the next step a retrieval task with clear boundaries instead of an open-ended hunt.
How should you gather and organize the sources behind each visual?
Treat the figure and its source data as one object with two layers. The figure is the presentation layer; the underlying records are the evidence layer. Both need to move together.
Start with a structured search when the source is a published paper. Use WisPaper search to locate candidate papers, then save the ones that feed specific exhibits to My Library. Keeping them in the library gives you a stable location to return to when a reviewer asks for the original report.
Collections and tags help when one source supports multiple parts of a deliverable. The same item can appear in several project groupings without duplication, while tags can record topics, methods, or workflow status. Apply the same logic to your visual plan:
- Tag a paper with the exhibit number it supports, such as
fig-2ortable-3. - Use a status tag such as
needs-recheckorapproved-for-deck. - Group sources by deliverable, not by where you happened to find them.
This matters for revision. When a client asks you to change one figure, you can retrieve every source tied to that exhibit instead of re-searching from memory.
How do you connect a chart to its source without slowing down the work?
The lightweight method is a source note attached to each visual. A source note for an internal decision memo might look like:
Exhibit 3: Enrollment by site, Q2. Source: trial registry record 2024-0412 and site coordinator extract dated July 14. Confidence: high for site counts; low for one site with missing month-end data. Request raw file:
/evidence/exhibit-3/.
The note has three fields that reviewers actually need: what the number came from, how confident you are, and where to get the underlying file.
Confidence levels are part of the artifact, not a disclaimer appended later. For a client-facing exhibit, write them in plain terms:
- High confidence: Values were checked against the original source and match.
- Medium confidence: Values were derived or transformed and checked once.
- Low confidence: Values rely on a source with known gaps or a provisional dataset.
When a figure draws from a publication, make the citation itself checkable. TrueCite screens BibTeX entries against real academic databases, which helps you catch references that do not correspond to actual published records. A figure built on a citation is only as dependable as the citation itself, and a hallucinated reference can quietly travel from a figure note into a client deck.
Should this be a table or a figure?
Use this decision table when the visual plan is ambiguous.
| The reader needs to... | Prefer a table | Prefer a figure |
|---|---|---|
| Compare exact values across a small number of groups | Yes, when precision matters | No, unless the pattern dominates |
| See a trend over time | Only for small series | Yes, line or slope chart |
| Compare relative size or composition | Only for audit-style reporting | Yes, bar, stacked bar, or dot plot |
| Check a relationship between two quantities | No | Yes, scatter or slope chart |
| Verify against an external standard | Yes, with source notes | Only as a secondary view |
The tiebreaker is precision versus pattern. If someone will read individual numbers aloud in a meeting, build a table. If someone needs to see direction, spread, or ranking, build a figure. Do not duplicate the same content in both forms just to fill space.
What does a submission-ready figure look like?
Submission readiness is less about polish than about whether someone outside the team can reconstruct the claim. Checklist for each table and figure before it leaves your desk:
- Every visual has one question it answers. If you cannot state it, the visual is doing too much.
- Every number has a named source. No orphan statistics.
- The source record is retrievable. The paper, file, or query is saved somewhere stable, not only in a slide.
- Confidence is explicit. A reviewer can see where the weak links are.
- The visual communicates without the presenter. Standalone captions and labels carry the meaning.
For a research paper, extend this with a link between reports and studies. Cochrane's workflow recommends linking reports of the same study so you do not double-count or misattribute findings. The same discipline helps when two figures cite different reports from one trial. Record that they belong to the same study in your source register before a reviewer notices the duplication.
When you have papers saved in My Library, a source-level question like "What did this paper report for the primary outcome at six months?" can be checked against the saved full texts through Library QA. That turns a spot check into a repeatable step: ask the question, compare the answer to the figure, and log the check in the artifact note.
How do you make revision less expensive?
Revision becomes expensive when a change forces you to re-find the evidence. Build for the reverse: make the evidence findable before the first review.
One practical routine is to create a named project for each deliverable and store the visual plan, source register, and saved papers together. When a stakeholder changes the analysis window or asks for a different comparison, the change request can be evaluated against a single project view. Papers add a further layer: records deposited with Crossref can carry DOI, title, author, publication, funder, license, and relation fields when deposited, so searching structured metadata often surfaces related work faster than scanning prose.
A revision workflow in three steps:
- Triage the request. Does it change the question, the source, or the presentation? Only the first two force a re-search.
- Re-run the narrow search. Use the same criteria you recorded in the visual plan. Update the plan, not just the chart.
- Re-check the citation layer. If new sources entered the deck, screen their BibTeX entries before the next review.
For longer evidence-gathering jobs, such as rebuilding the source base for an entire section, Scholar Agent is designed for extended research tasks with literature review or related use cases. Use it for the structured sweep, then route the outputs through the same source-note process as every other exhibit.
How should you handle a year-end or project closeout reset?
Closeout is when evidence decays. Files move, people leave, and a deck that was traceable in March becomes a mystery in December. A reset has one goal: make the evidence base survive the handoff.
Build a closeout package per deliverable:
- Exhibit map. One row per table and figure with the question, source, and confidence level.
- Source register. The named papers, datasets, and queries behind each exhibit.
- Reproduction notes. Enough detail for a new person to regenerate the main figures.
- Open items. Anything with low confidence or a missing source stays visible instead of being silently dropped.
If a figure came from a paper that your team can no longer locate, treat it as an open item. Do not publish it with implied certainty.
For reproduction-heavy work, such as when a team needs to rebuild a chart from a published study, PaperClaw supports reproduction planning from an uploaded PDF and reproduction instructions. The point is not to automate the final figure, but to open the black box: a clear reproduction plan turns a fragile visual into a repeatable artifact.
What entry route fits your current stage?
Different teams hit this guide at different moments. Choose the route that matches your state.
Route A: You are about to build a new report or deck. Start with the visual plan. Decide the subquestions first, then search and save sources, then build exhibits with source notes.
Route B: You are mid-revision and reviewers are asking for sources. Run the submission-readiness checklist on existing exhibits. Add source notes and confidence levels without redesigning anything yet.
Route C: You are closing out a project or resetting for the next cycle. Build the closeout package. Prioritize the exhibit map and the open-items list.
Route D: You inherited a messy evidence base. Reconstruct it exhibit by exhibit. For each visual, ask the Library QA question, log the answer, and decide whether the visual can stay or needs a flagged confidence level.
How do you know the result is ready?
The end state is not a perfect chart. It is a chart that survives a stranger's question. A visual is ready when all five checklist items hold and when two specific tests pass:
- The cold-handoff test. Give the exhibit map and source register to someone who did not work on the project. If they can find the underlying source for every number without asking you a question, the evidence layer is done.
- The one-change test. Change one input, one source, or one date. If the team can identify every exhibit affected within a few minutes, the retrieval workflow is working.
Tables and figures are decision objects, not decorations. When the underlying sources are findable, the confidence levels are explicit, and the path from source to visual is reconstructible, the chart is ready to leave the room.
FAQs
Keep Reading

The Editor Asks for a Reporting Checklist at Submission: How to Respond Without Stalling Your Paper
You submit what feels like a finished manuscript and get a desk-level reply you did not expect: “Please complete the appropriate reporting checklist and upload it with your revised materials.” The request often lands alo

The Journal Word Limit Is 2,000 Words Shorter Than Your Draft
You open the submission portal, paste your abstract, and then hit the word-count box: 2,478 words. The journal allows 2,000 for the main text. Now you have a compressed revision problem with a hard constraint, coauthors

The Paper Is Published but the Research Trail Is Disappearing: Rebuild Your Method Trail Before the Next Submission
Your manuscript is accepted, the DOI is live, and the citation count is starting to move. Then a reviewer for the next project asks how you built the search string from two years ago, and you realize you cannot produce i