
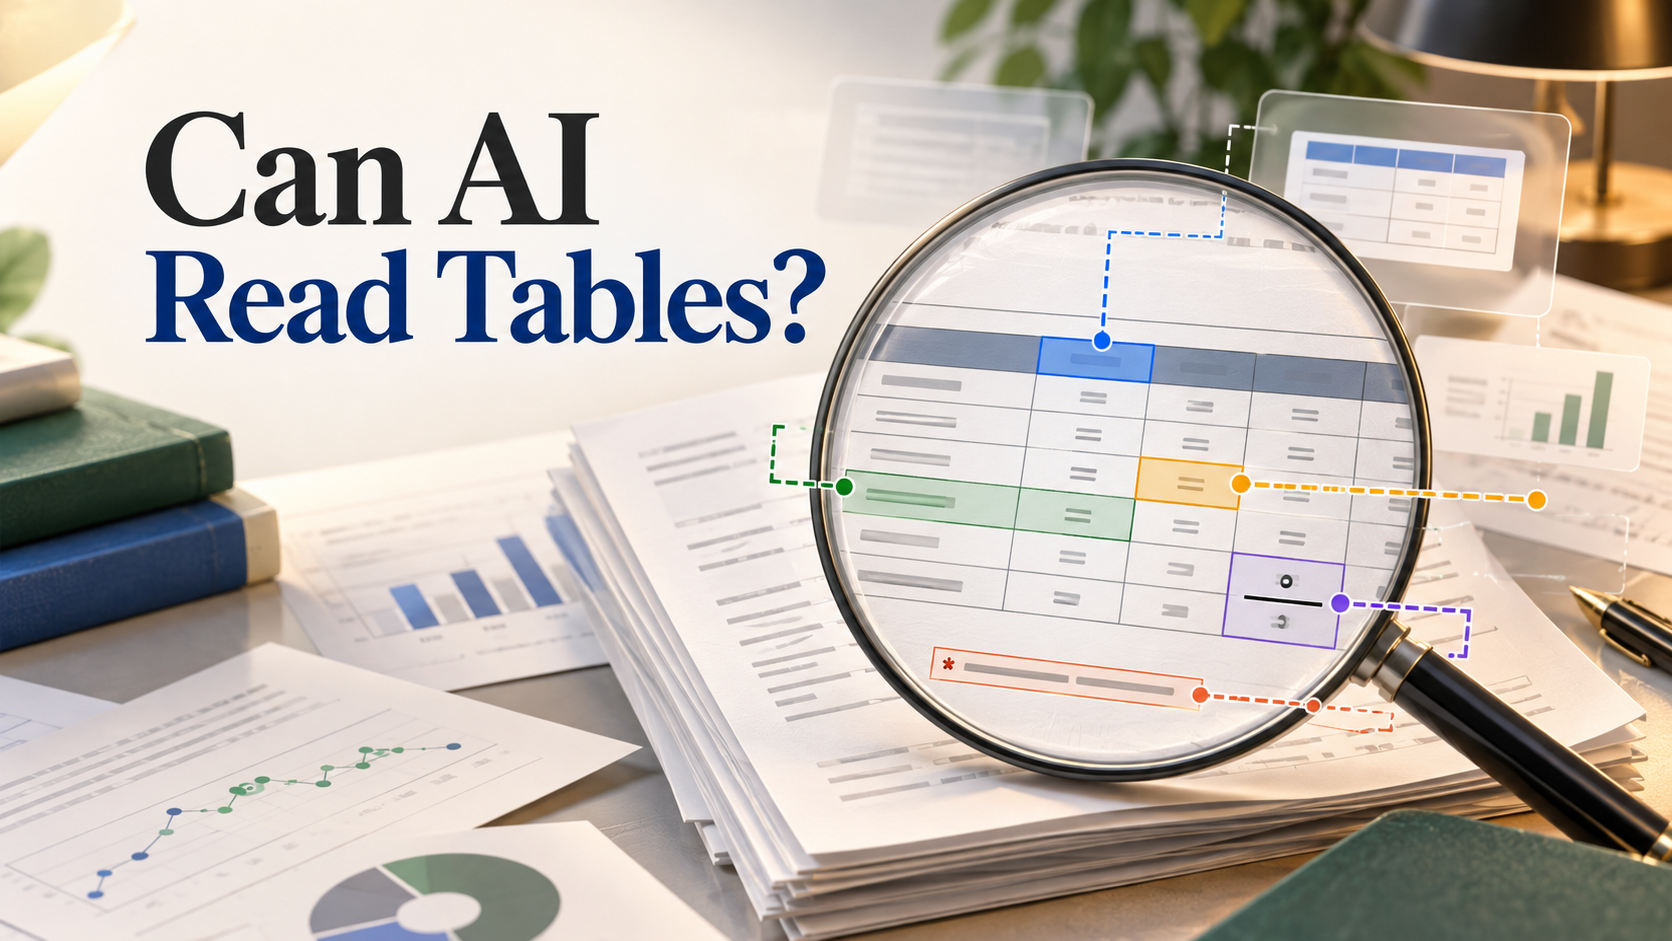
AI can read a clean research table surprisingly well. The risk begins when a correct cell is attached to the wrong header, denominator, time point, or statistical comparison.
I checked four tables in a full-text randomized trial of a digital sleep intervention. They included intervention content, control content, baseline characteristics, and module completion. I selected twelve values that could be verified directly against the table text.
What was easy to extract?
Simple label-value pairs worked well: 96 participants in the intervention group, 99 in control, 74 women in the intervention group, and 49 intervention participants completing module one.
The table also made the engagement drop visible: completion fell from 49 participants for module one to 21 for module five. That pattern matters when interpreting the trial's result.
Where could a correct number become a wrong claim?
Consider “49.” Without its headers, it could mean participants, percent, a baseline count, or a follow-up result. In the table it meant 49 participants, shown as 51% of the intervention group, completed module one.
Common table-reading errors include:
- carrying a column header across the wrong subgroup
- confusing n with percent
- dropping the unit from a mean
- reading a baseline value as a treatment effect
- treating a footnote-defined subgroup as the full sample
- losing minus signs, confidence intervals, or significance labels
PDF extraction can make these worse when columns are flattened into one line or a table is actually an image.
A safer table prompt
Do not ask, “Summarize this table.” Ask for a cell-level audit:
Extract the table title, column headers, row label, value, unit, denominator, and footnote for each requested cell. Preserve confidence intervals and minus signs. Do not interpret a value until you can state its row and column coordinates. Mark merged or unclear cells for manual review.
Then spot-check values that matter to your argument. In an intervention paper, those are often sample size, baseline imbalance, primary outcome, effect estimate, attrition, and adverse events.
Use full text and verify the table
Upload or save the paper in My Library, then use Library QA to ask a narrow table question. Keep the original PDF beside the answer. If the table is scanned, complex, or split across pages, manual reading is faster than debugging a confident extraction.
Accurate digits are not enough. A table answer is trustworthy only when the coordinates and meaning travel with the value.
FAQs
Keep Reading
Can AI Spot Contradictions Across Research Papers? A Small Test
Learn how AI can detect opposite-looking findings and how to separate true contradictions from differences in study design.
Can AI Summarize a Paper from Its Abstract Alone? A Full-Text Check
See what an abstract-only AI summary gets right, what full text changes, and how to run a source-grounded correction pass.
Can AI Tell Whether a Research Idea Is Actually New?
Check whether an AI-generated research idea is actually new by testing its concepts, methods, populations, and closest prior work.